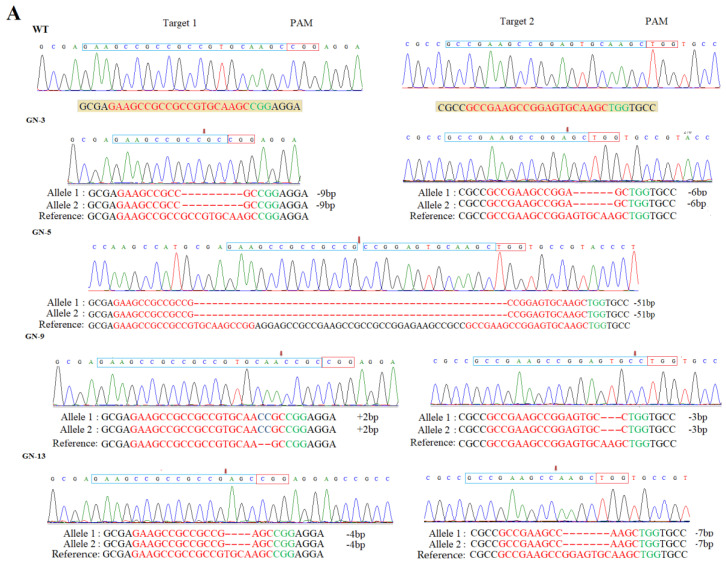
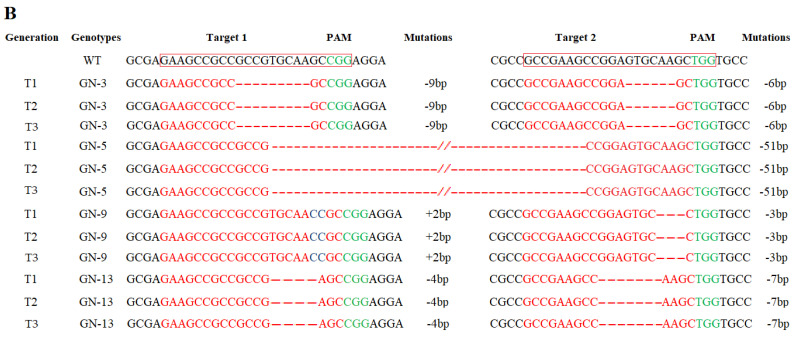
Figure 1.
Detection of mutations induced by CRISPR/Cas9; (A) chromatograms showing the sequencing results for both the target sites in mutant lines; (B) inheritance of mutations in T1 and T2 and T3 generations. Red hyphens and letters represent the deletions and blue letters represent insertions, respectively while the PAM sequence is highlighted in green.


