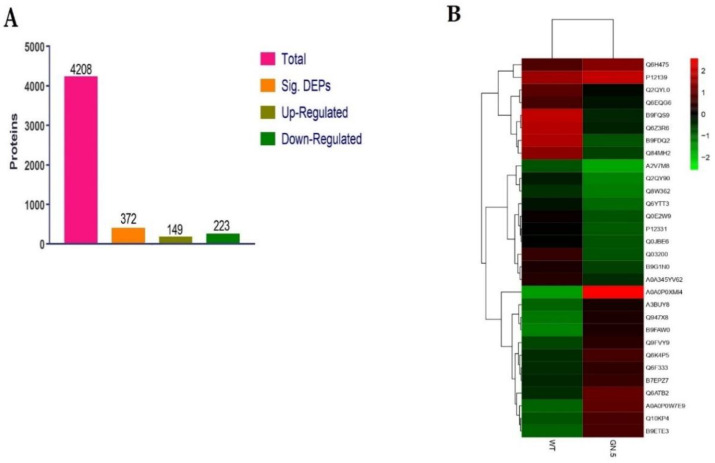
Figure 3.
Identified proteins and heatmap of wild type and CRISPR mutant line (GN-5). (A) The number of the total, and differentially expressed proteins (up and down-regulated). (B) Proteins with higher expression difference among WT and mutant. Red color denotes higher while the green color is representing the lower level of expression.

