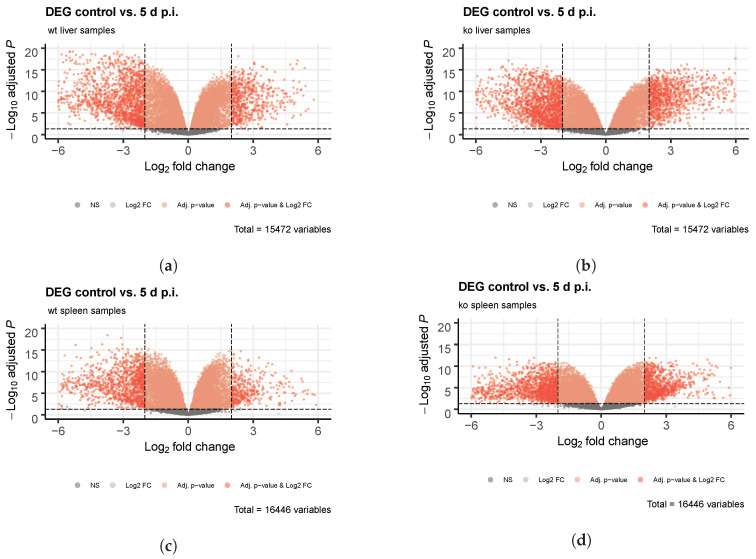
Figure A3.
Volcano plots showing the differentially-expressed genes (DEG) that proceeded to the analyses. DEG were filtered by log2FC ≥ 2 and adjusted p value ≤ 0.05. These comparisons were performed both organ and genotype-wise: (a) liver wt, (b) liver ko, (c) spleen wt, (d) spleen ko. ko, LyΔ6EDHSC

