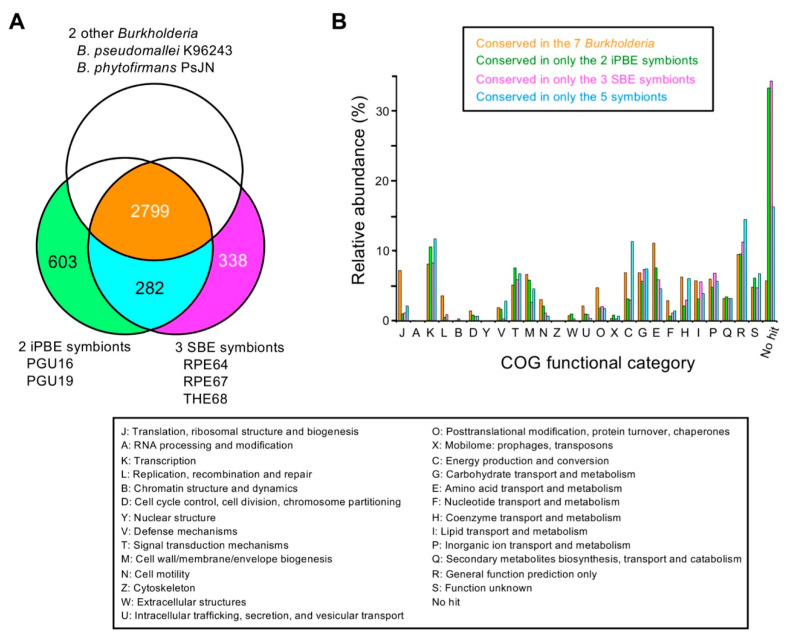
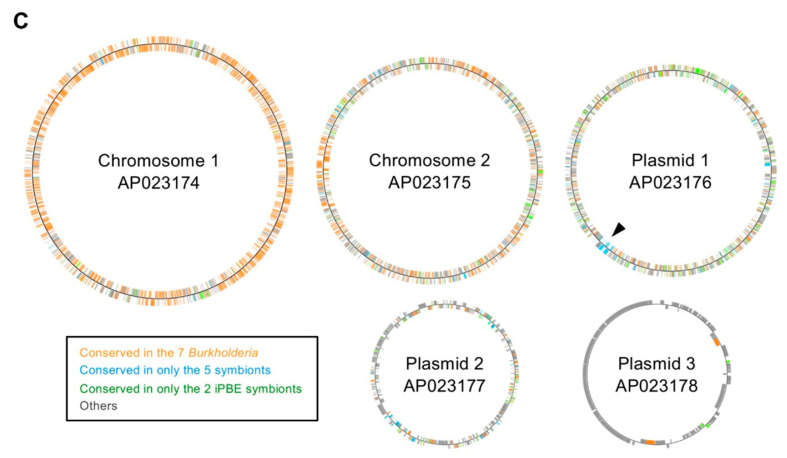
Figure 5.
Comparative genomics for highlighting conserved genes among the five Burkholderia symbionts of stink bugs. (A) Venn diagram for the comparison between the five symbionts and the other two Burkholderia. The number of orthogroups is shown. One orthogroup may include two or more genes from a genome. (B) Relative abundance of the conserved orthogroups classified into each COG functional category. Since one orthogroup may be classified into two or more categories, the sum of relative abundance can be over 1. The description of each COG category is shown below the panels A and B. (C). The distribution of the conserved genes on the genome of the iPBE symbiont PGU16. The arrowhead indicates the region that contains the cluster of conserved genes in the five symbionts.


