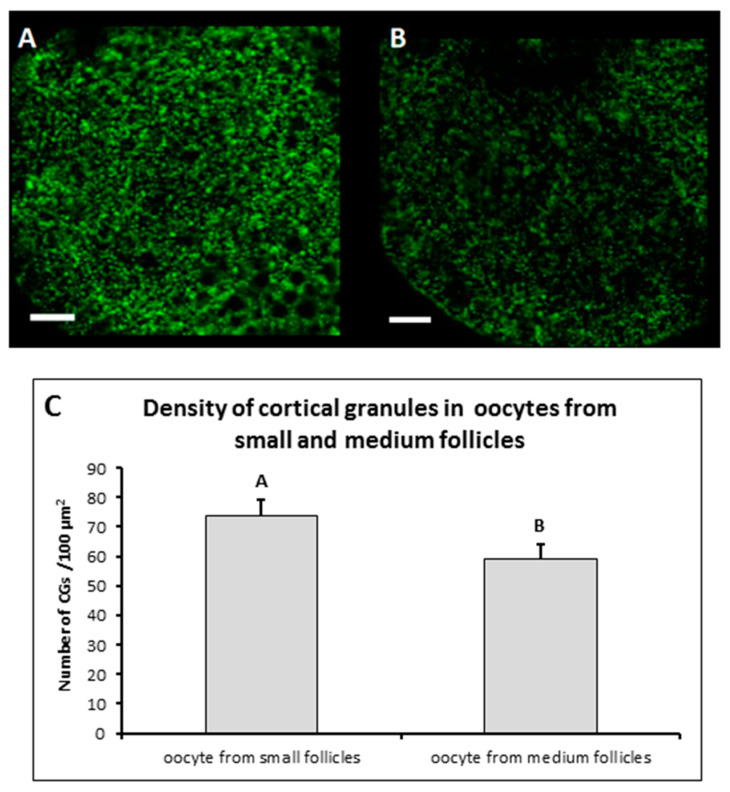
Figure 2.
Cortical granule density after IVM. Representative images of porcine oocytes periphery after 44 h maturation in oocytes from small (A) and medium (B) follicles. Oocytes were stained by PNA-labeled FITC (green color—cortical granules). Scale bar represents 10 µm. The mean (±SD) of cortical granule density was significantly higher in oocytes from small follicles than in oocytes from medium follicles (C).

