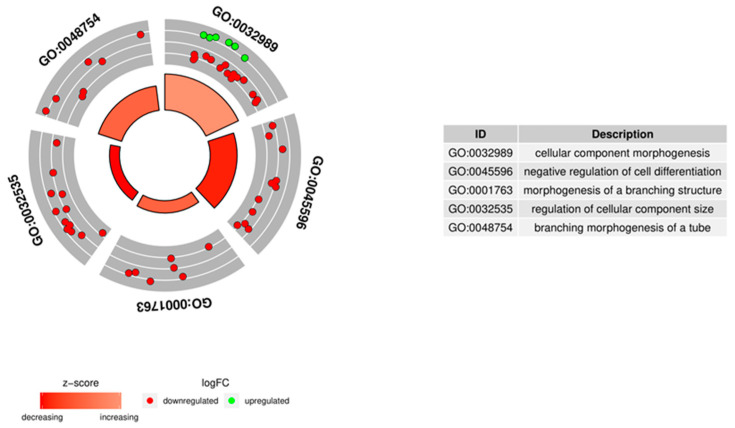
Figure 5.
Circle plot showing the differently expressed genes and Z-scores of the “cellular component morphogenesis”, “negative regulation of cell differentiation”, “morphogenesis of a branching structure”, “regulation of cellular component size”, and “branching morphogenesis of a tube” Gene Ontology Biological Process (GO BP) terms. The outer circle shows a scatter plot for each term of the fold change of the assigned genes. Green circles represent upregulation and red ones represent downregulation. The inner circle shows the Z-score of each GO BP term. The width of each bar corresponds to the number of genes within GO BP term and the color corresponds to the Z-score.

