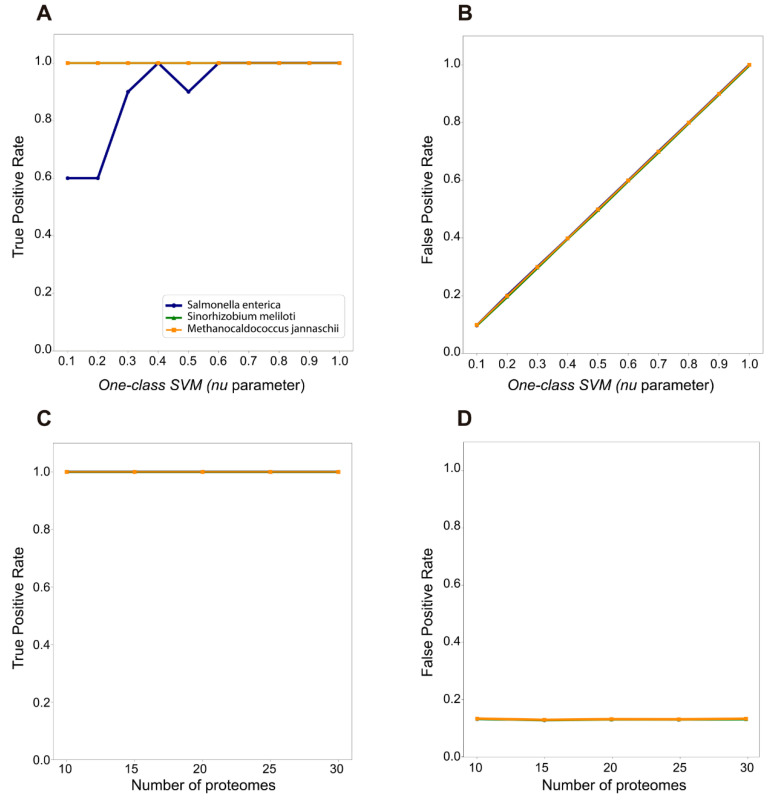
Figure 2.
True positive (TP) and False positive (FP) rate curves for showing the performance of ShadowCaster according to the two user defined parameters: nu and number of proteomes. TP and FP rate curves corresponding to the nu parameter are shown in (A,B) while (C,D) display the same curves influenced by the number of proteomes.

