
Figure 3.
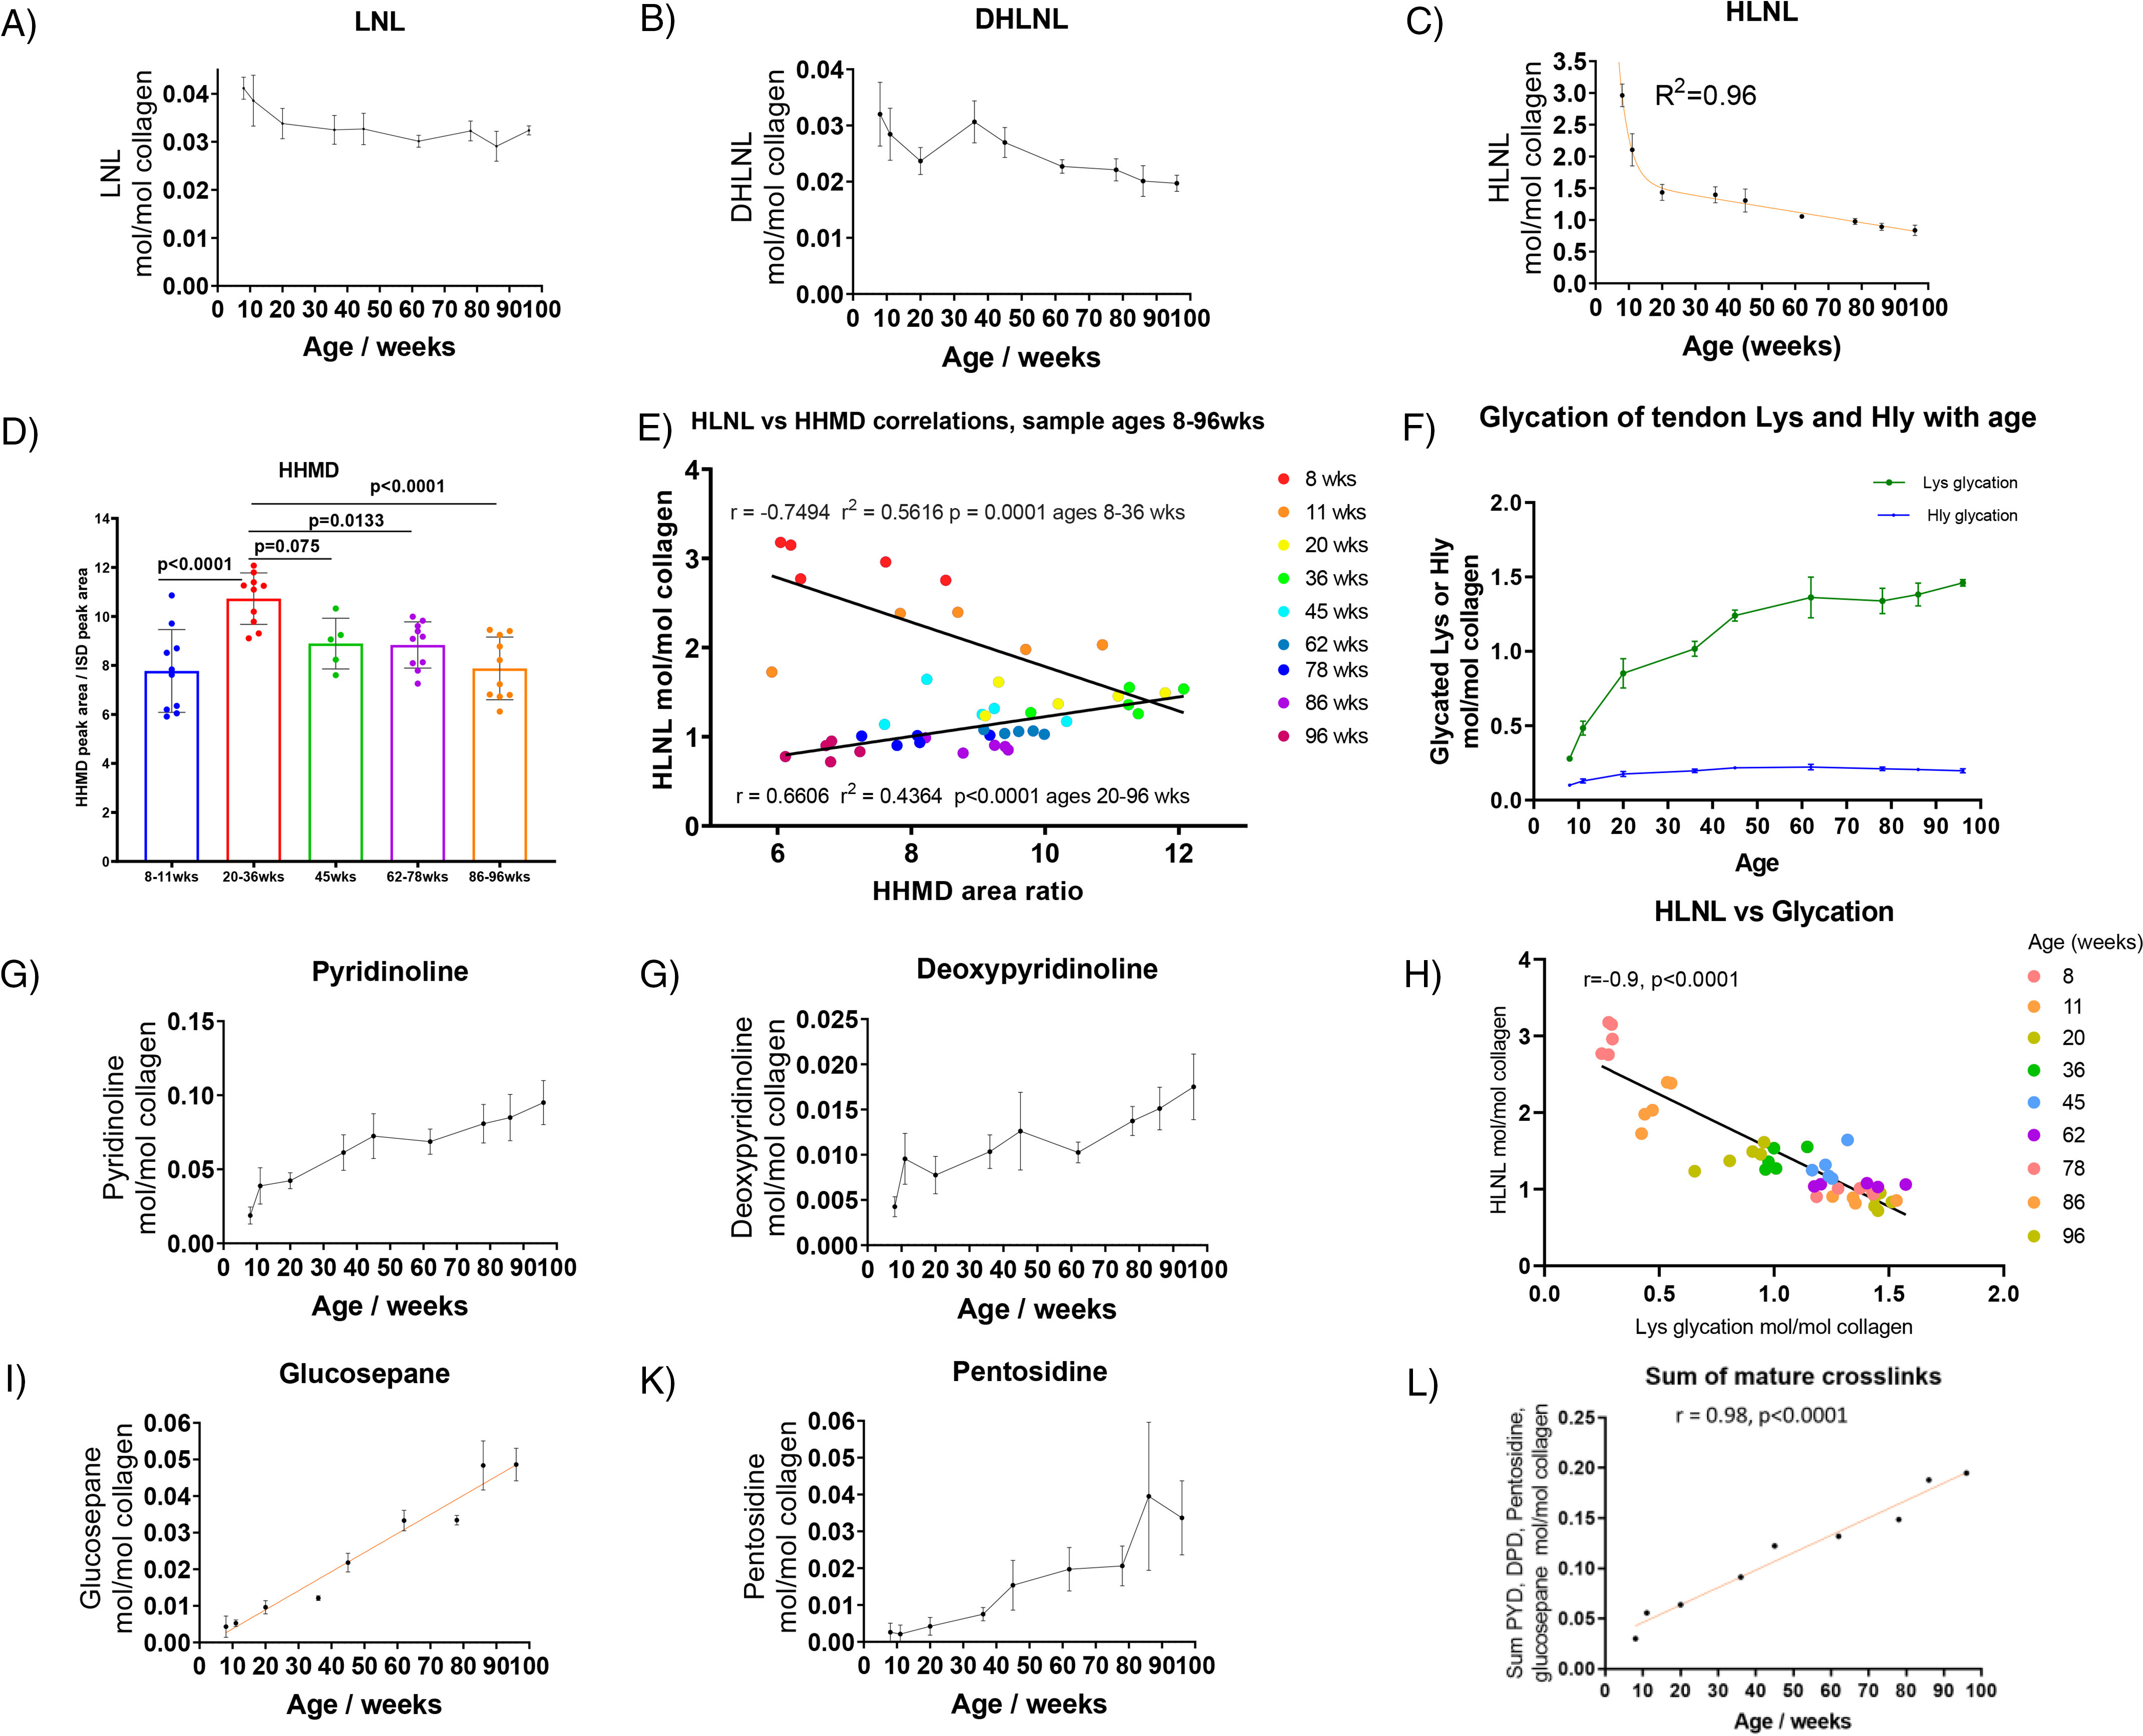
A, B, and C, levels of the immature cross-links LNL, DHLNL, and HLNL with age in the tendon fibers of C57BL/6 mice (n = 5 per age group, in duplicate). Statistical analysis: nonlinear regression fit shown in the HLNL plot (mean ± S.D.). D, Change in the aldol product HHMD with age. Statistical analysis: ANOVA followed by Tukey's multiple-comparison tests (mean ± S.D., n = 5 to 10). E, Correlations between HLNL and HHMD with age. Statistical analysis: linear regression. F, levels of glycation products with age (mean ± S.D., n = 5, in duplicate). Lys glycation is shown in green; Hly glycation is shown in blue. G, H, J, and K, development of irreversible cross-links with age in the tendon fibers of C57BL/6 mice (n = 5, in duplicate). Statistical analysis (J): linear regression fit (mean ± S.D., n = 5, in duplicate). I, correlation between HLNL levels and glycation levels. Statistical analysis: linear regression. L, sum of PYD, DPD, pentosidine, and glucosepane collagen values (mol/mol) plotted against age. Statistical analysis: linear regression.