
Figure 1.
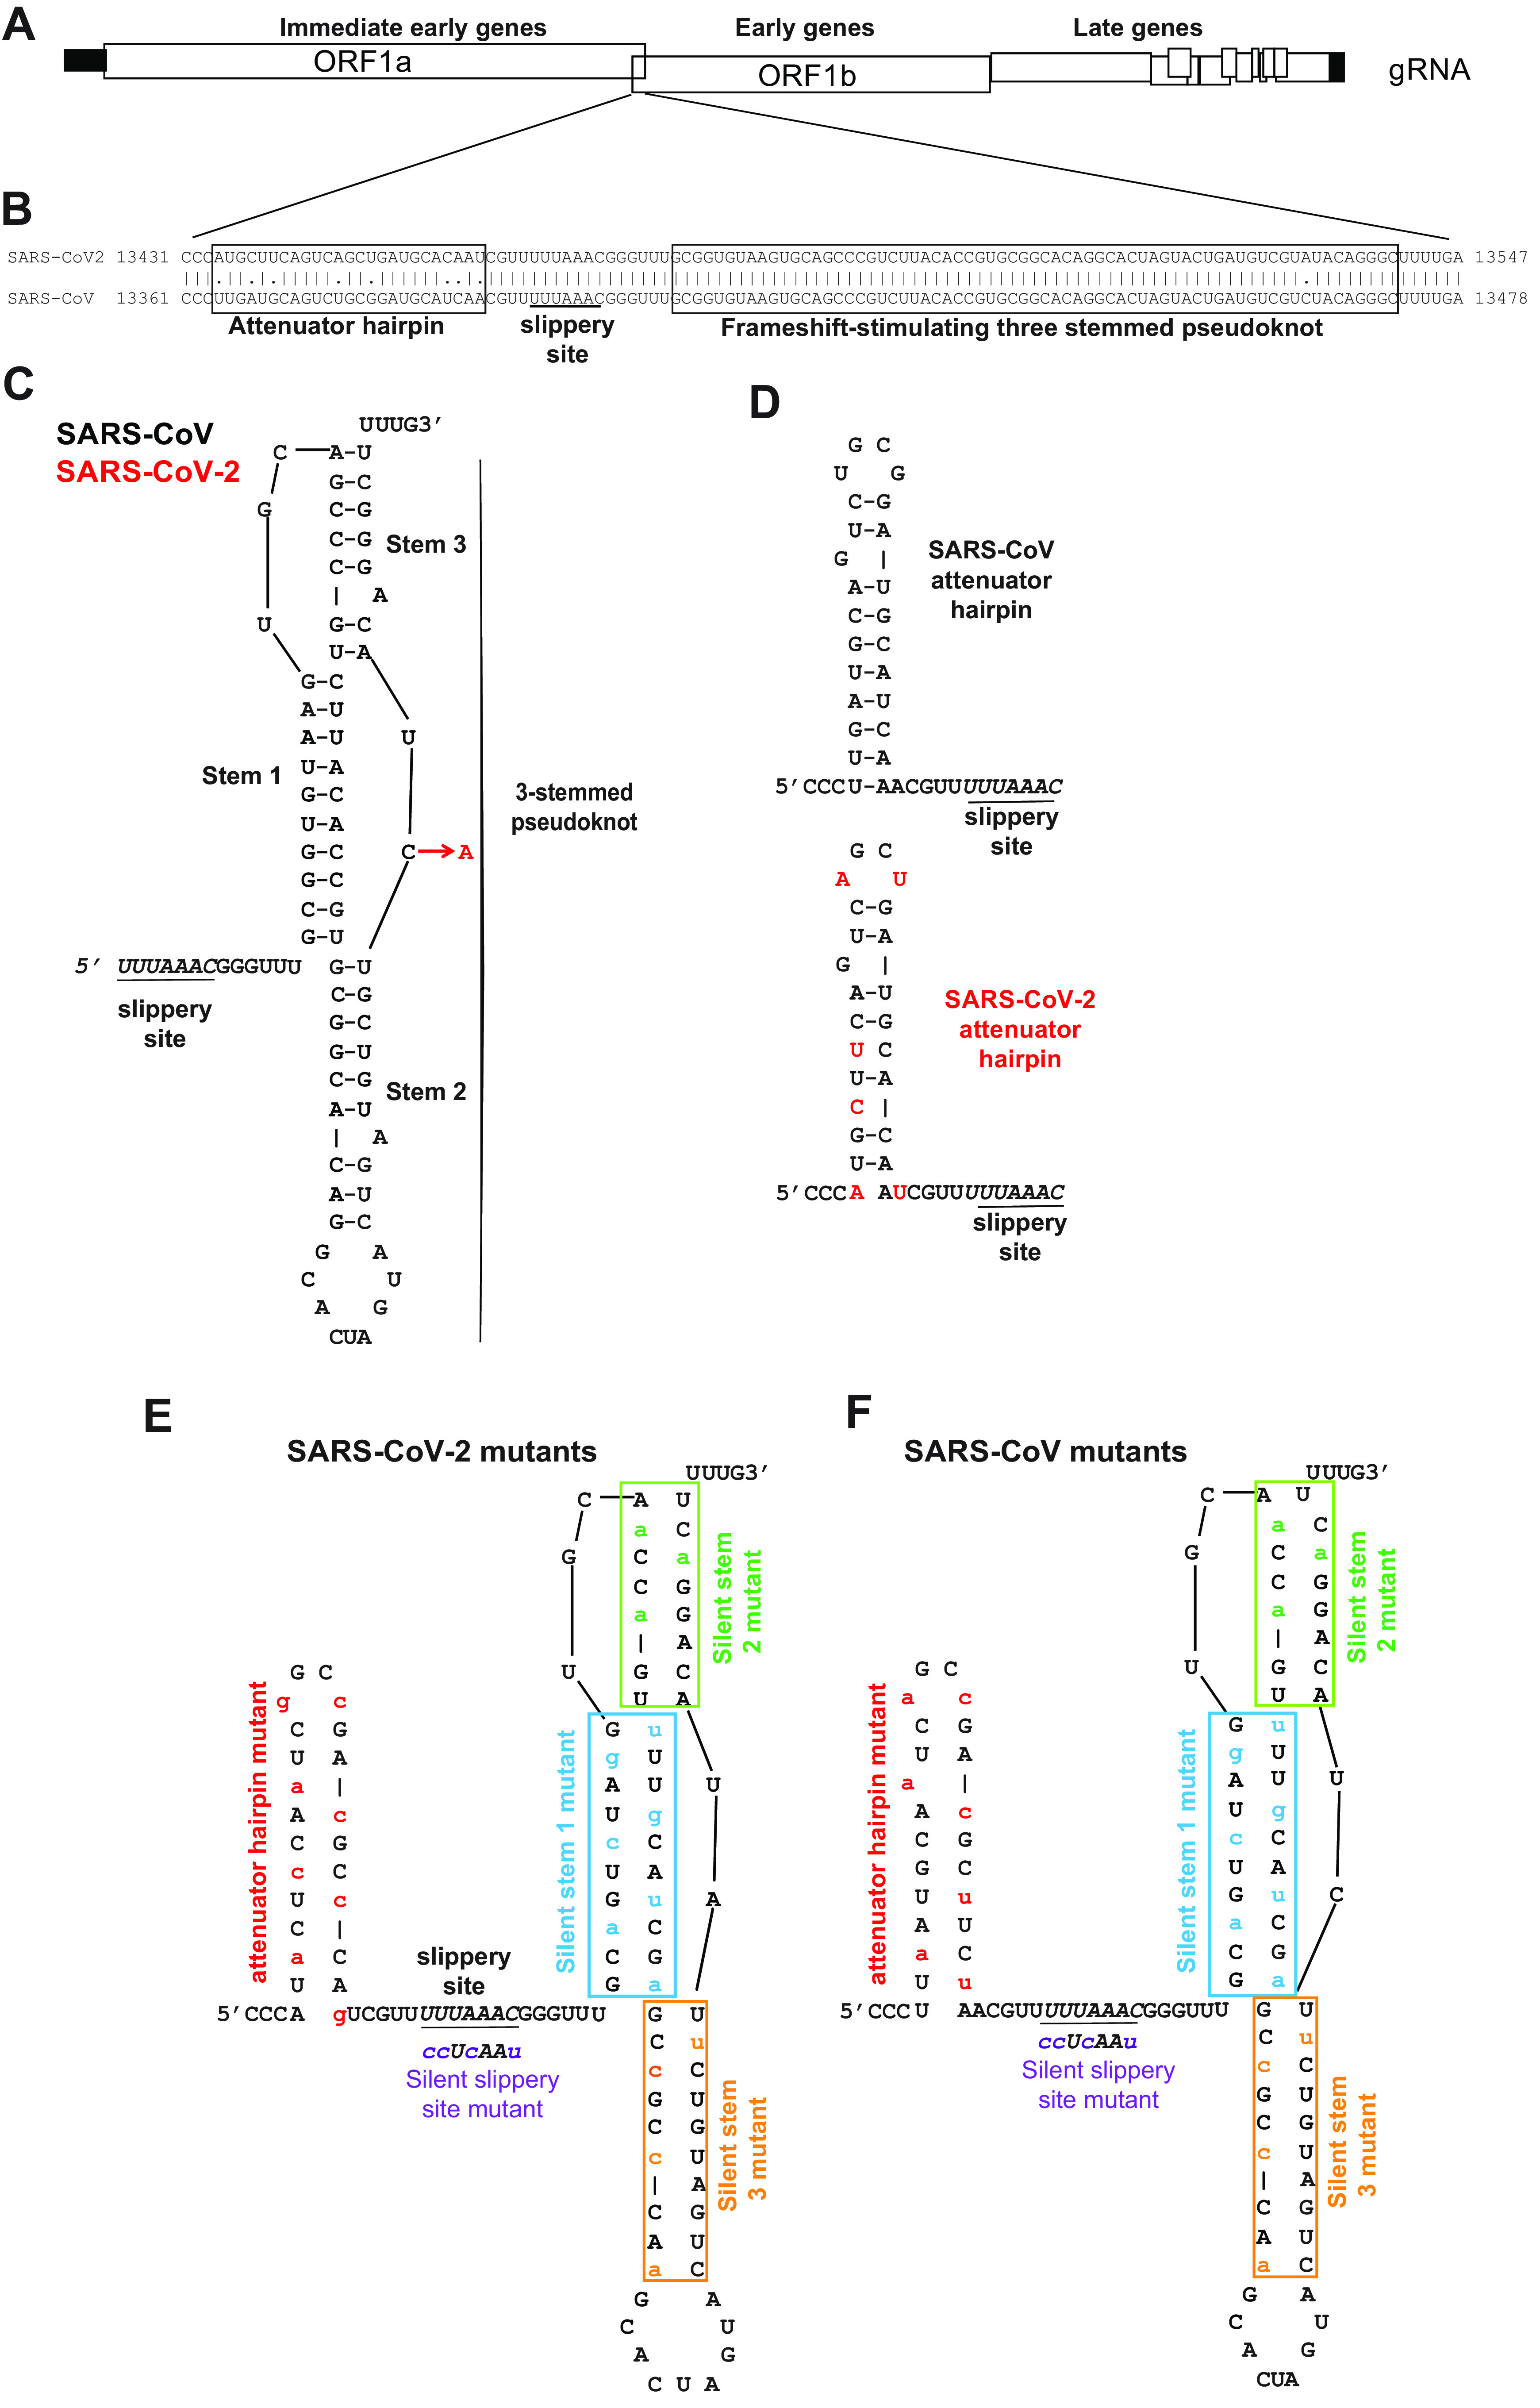
Structural comparison of the SARS-CoV and SARS-CoV-2 −1 PRF signals. A, cartoon depicting SARS-CoV and SARS-CoV-2 genome organization including a −1 PRF between ORF1a and ORF1b. B, pairwise analysis of the two −1 PRF signals. The attenuator elements and three-stemmed pseudoknot sequences are boxed as indicated. The U UUA AAC slippery site is underlined. C, structure of the SARS-CoV −1 PRF signal (11) is composed of the 5′ slippery site, a 6-nt spacer, and the three-stemmed pseudoknot stimulatory element. The single-base difference in SARS-CoV-2 (red) maps to the short loop linking stems 2 and 3. D, comparison of the SARS-CoV and SARS-CoV-2 −1 PRF attenuator elements. SARS-CoV-2–specific bases are indicated in red. E and F, silent coding mutations designed to disrupt the attenuators, slippery sites, and stems 1, 2, and 3 in the SARS-CoV-2 (E) and SARS-CoV (F) −1 PRF signals. gRNA, genomic RNA.