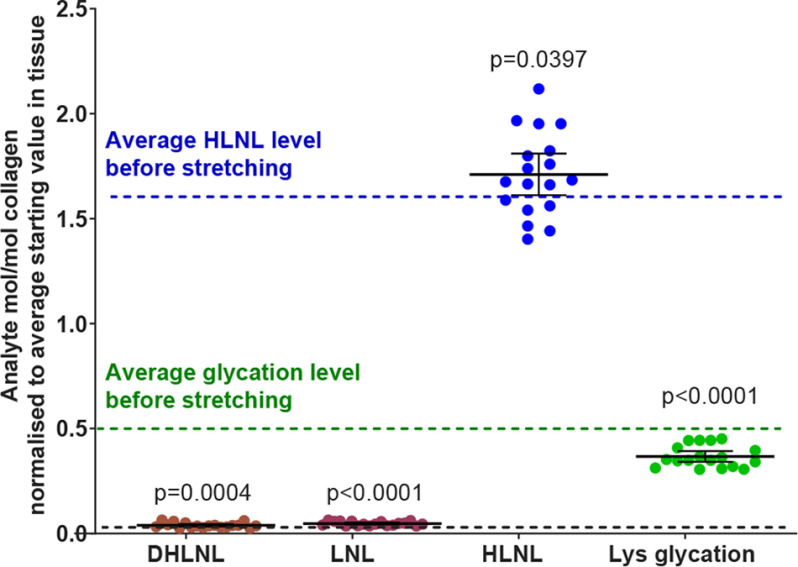
Figure 6.
Graph shows the change in analytes on stretching tail tendon fibers of C57BL/6 mice to 4% strain normalized to the average mol/mol collagen value before stretching (mean ± 95% CI; n = 18 mice). Statistical analysis: two-sided ratio Student's paired t tests. This plot highlights the relative abundance of each analyte.

