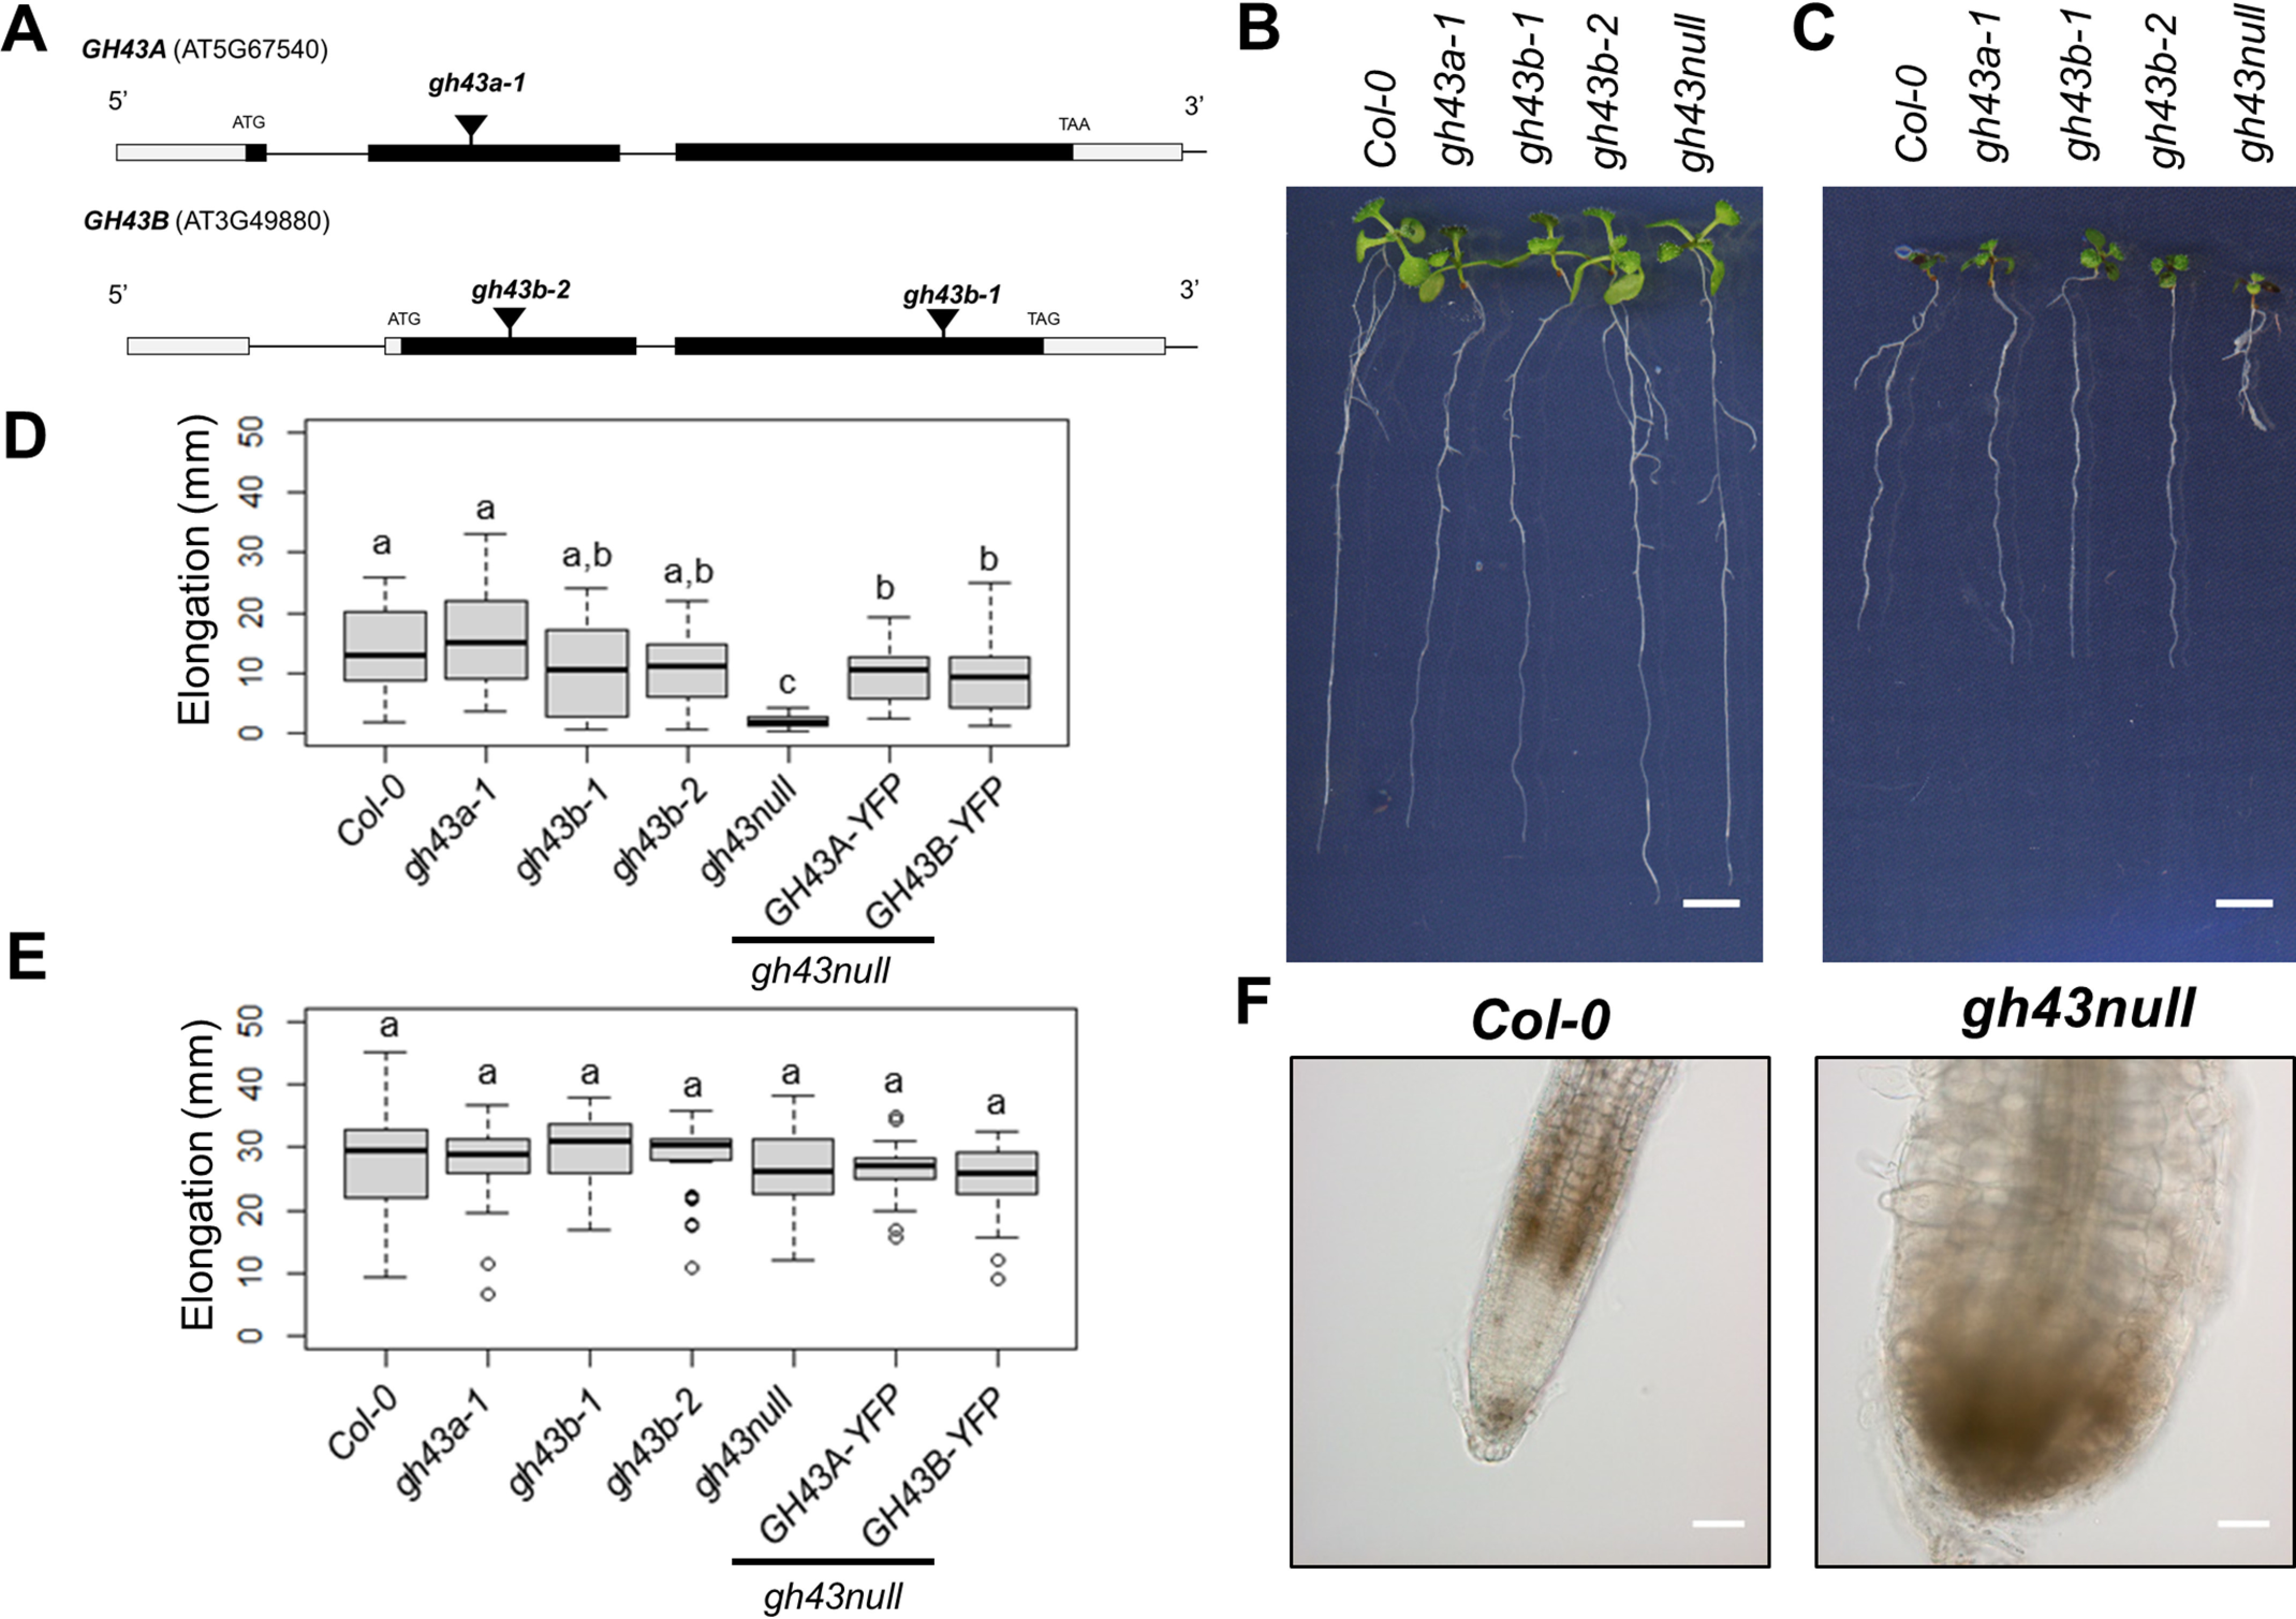
Figure 1.

Characterization of the gh43 Arabidopsis T-DNA insertion lines. A, schematic diagram of the GH43A and GH43B gene structure and the T-DNA insertion sites. The white and black boxes indicate untranslated and translated regions, respectively. B, Col-0 and gh43 seedlings grown on nutrient media without sugar for 4 days and then moved to media without sugar for 6 days. Scale bar = 5 mm. C, Col-0 and gh43 seedlings grown on nutrient media without sugar for 4 days and then moved to media with 4.5% glucose for 6 days. Scale bar = 5 mm. D, root elongation of Col-0 and gh43 seedlings grown on nutrient media without sugar for 4 days and then 6 days on media with 4.5% glucose. The box plot's dark horizontal lines represent the median, the two gray boxes the 25th and 75th percentile, the whiskers the 1.5 interquartile limits, and the dots the outliers (n = 25–28 biological replicates). Means not sharing a common letter are significantly different at p < 0.05, as determined by Tukey's test after one-way ANOVA. E, root elongation of Col-0 and gh43 seedlings grown on nutrient media without sugar for 4 days and then 6 days on media without glucose. The box plot's dark horizontal lines represent the median, the two gray boxes the 25th and 75th percentile, the whiskers the 1.5 interquartile limits, and the dots the outliers (n = 25–28 biological replicates). Means not sharing a common letter are significantly different at p < 0.05, as determined by Tukey's test after one-way ANOVA. F, light microscopy images of Col-0 and gh43null root tip after seedlings were grown 4 days on nutrient media followed by 6 days on 4.5% glucose media. Scale bar = 100 μm.
