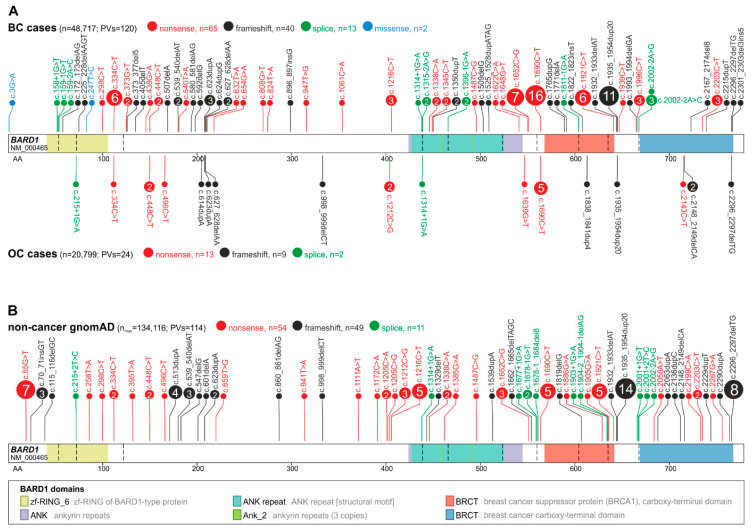
Figure 1.
Maps of deleterious PVs in BARD1. PVs are shown alongside the BARD1 coding sequence with the indicated exon structure and the protein functional domains. The size of a PV symbol (circle) is proportional to the number of PVs, and color indicates the type of PV. (A) PVs detected in BC (above) and OC (below) cases. (B) PVs reported in noncancer gnomAD controls. The total number of detected PVs and the total number of cases and controls tested for the variants are indicated in parentheses; note that the total number of tested subjects differs substantially between groups.

