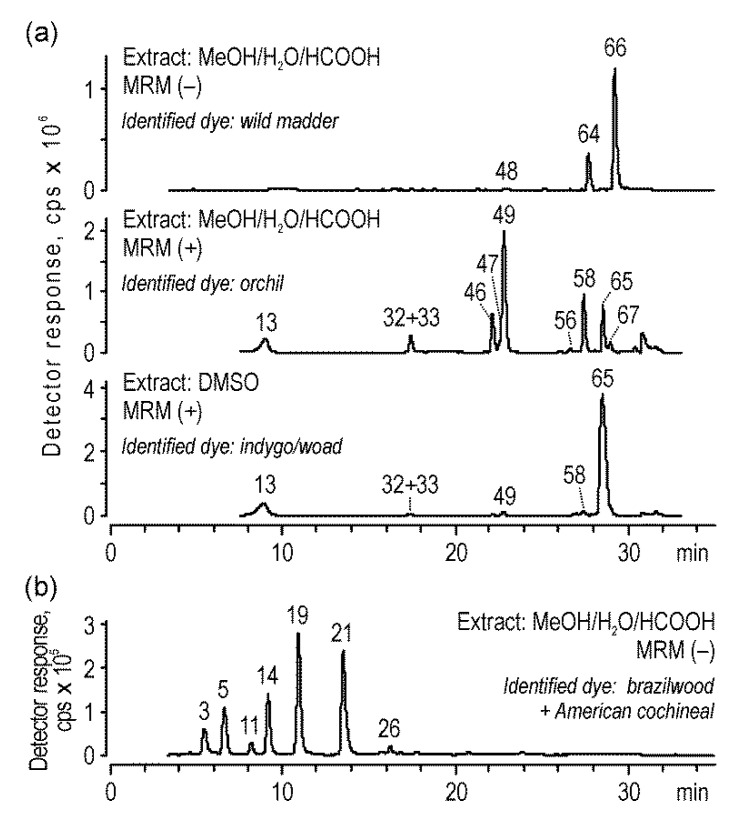
Figure 8.
Chromatograms acquired for the extracts of the (a) blue sample (textile No. 282) and (b) red sample (textile No. 198) by the MS detector in negative and/or positive multiple reaction monitoring (MRM) modes; peak numbers are decoded in Table 1.

