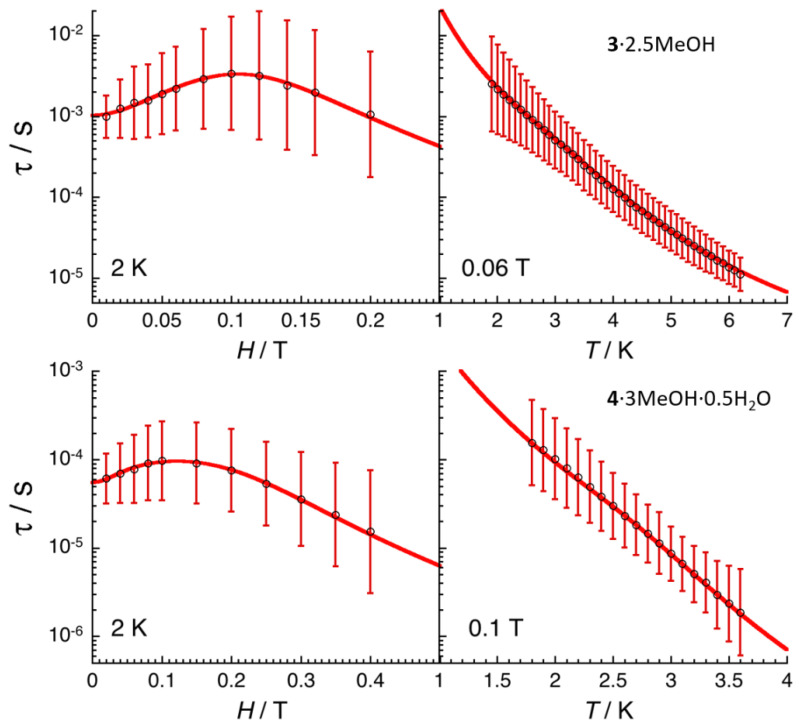
Figure 10.
Field (left) and temperature (right) dependencies of the relaxation time (τ) at 2.0 K and in the presence of an applied static field of 0.06 and 1 T for complexes 3∙2.5MeOH (top) and 4∙3MeOH∙0.5H2O (bottom), respectively. The relaxation time was estimated from the generalized Debye fits of the ac susceptibility data shown in Figure 8 and Figure 9, Figures S10 and S13. The estimated standard deviations of the relaxation time (vertical solid bars) have been calculated from the α parameters of the generalized Debye fit (Figures S11–S15) and the log-normal distribution as described in ref. [81]. The solid red lines are the best fit discussed in the text.

