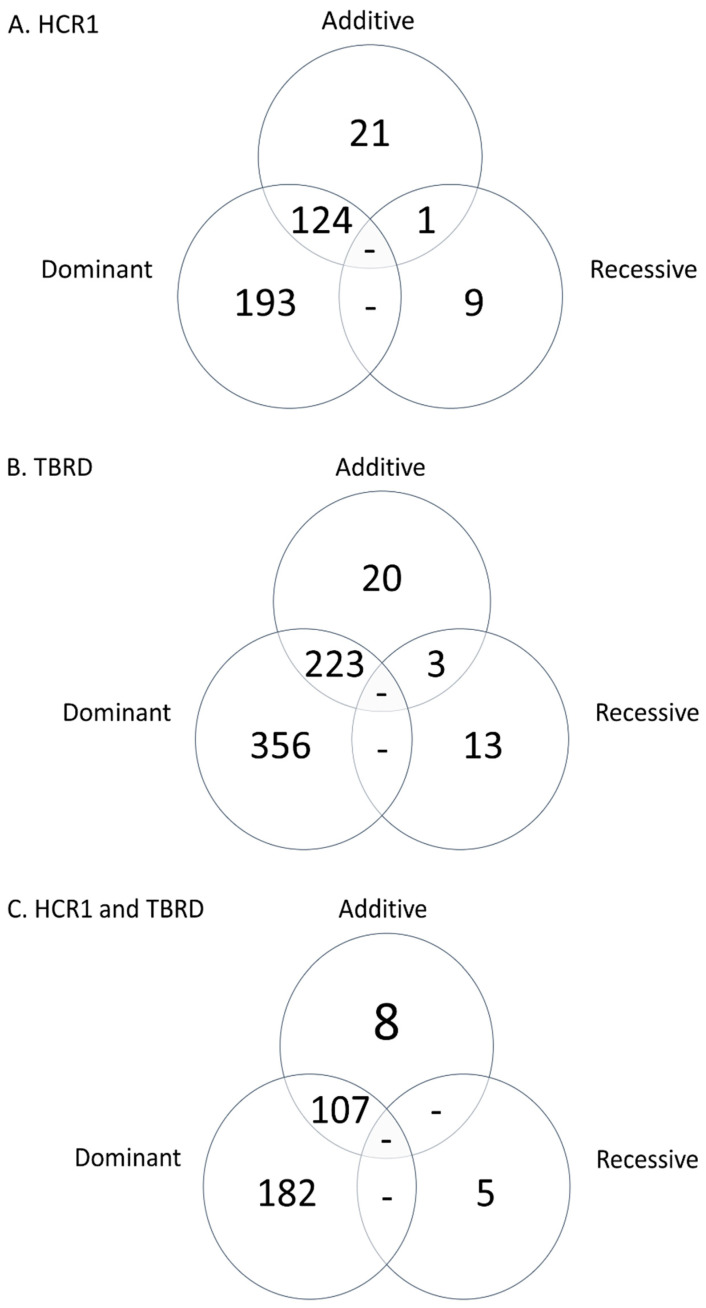
Figure 3.
Venn diagram of the additive, dominant and recessive loci associated with conception rate to first service (HCR1) and the number of times bred (TBRD) to achieve a pregnancy in Holstein heifers. The number of loci associated in each model for heifer conception rate to first service (HCR1; Panel A), number of times bred before a pregnancy was achieved (TBRD; Panel B) and number of loci associated that were shared in HCR1 and TBRD (Panel C) are shown.

