Figure 1.
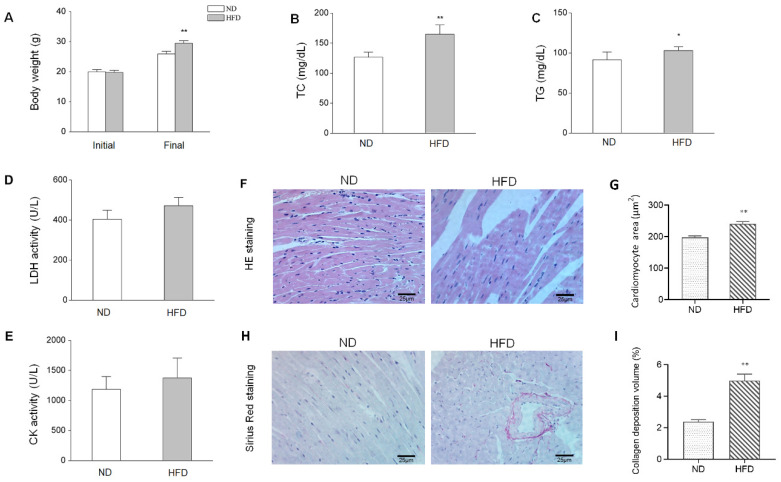
HFD-induced biological characteristics and histopathological alterations. (A) Changes in body weight after eight weeks of a normal diet (ND) or high-fat diet (HFD), n = 12. (B–C) Serum levels of TC and TG in mice in the ND and HFD groups. (D-E) Alterations of serum LDH and CK activities between groups, n = 5. (F) H&E staining of myocardium tissues (×400) from ND and HFD groups. (G) Quantitative analysis of cardiomyocyte cross-sectional area between groups, n = 4. (H) Sirius Red staining of the myocardium tissues (original magnification × 400). (I) Quantitative analysis of collagen deposition volume between groups, n = 4. Data represent means ± SD; * p <0.05, ** p <0.01, HFD vs. ND group.

