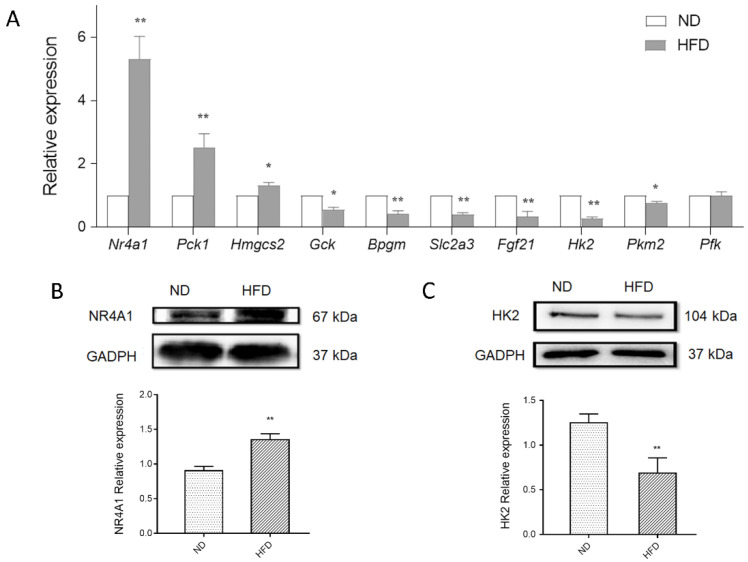
Figure 6.
Effect of Nr4a1 on glucose metabolism homeostasis (A) Expression of glucose metabolism related DEGS and key genes in glycolysis metabolism in the myocardium, in response to a normal diet (ND) or high-fat diet (HFD) using qPCR. (B,C) Protein expression of NR4A1 and HK2 between groups. Data represent means ± SD; n = 3, * p < 0.05, ** p < 0.01, HFD vs. ND group.

