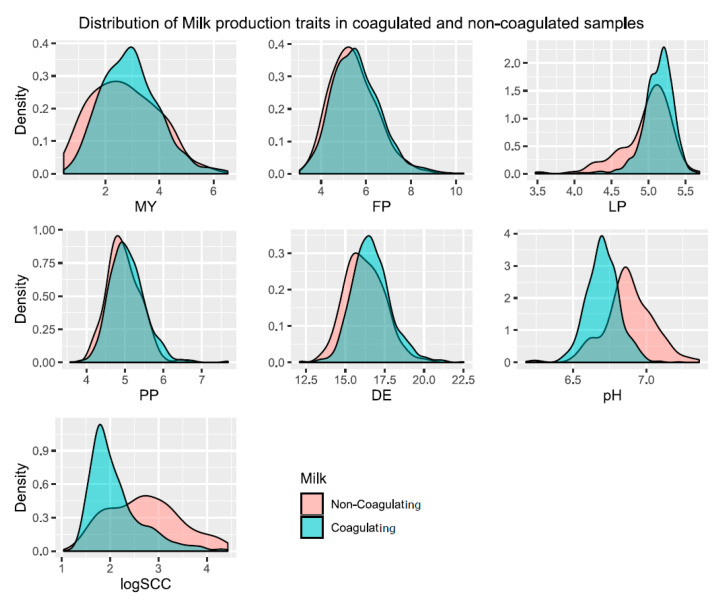
Figure 3.
Distribution of the milk trait values in relation to the coagulation success factor. This figure displays the distribution of values of the seven milk traits considered in this study in contrast to the coagulation success factor (coagulating or non-coagulating milk). Represented traits are milk yield (MY), protein percentage (PP), fat percentage (FP), lactose percentage (LP), dry extract (DE), pH, and the decimal logarithm of somatic cell counts (logSCC).

