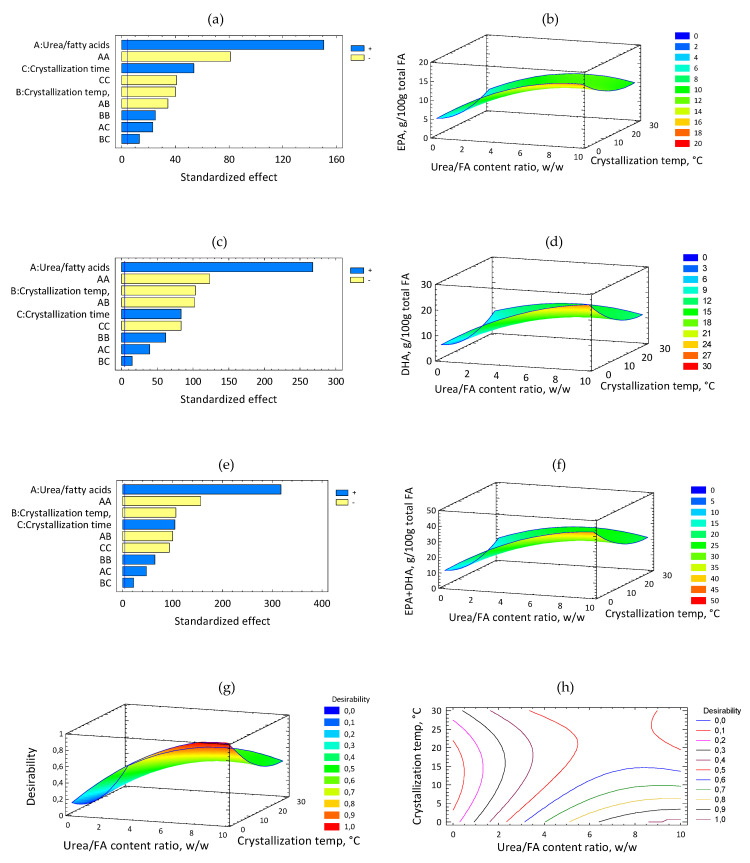
Figure 1.
Effect of urea/fatty acid (FA) content ratio and crystallization temperature. Panels (a), (c), (e) (EPA, DHA, EPA+DHA standardized Pareto diagrams, respectively). Panels (b), (d), (f) (EPA, DHA, EPA+DHA response surface content (g/100 g total FA), respectively). (g) desirability function; (h) contours of estimated response surface.

