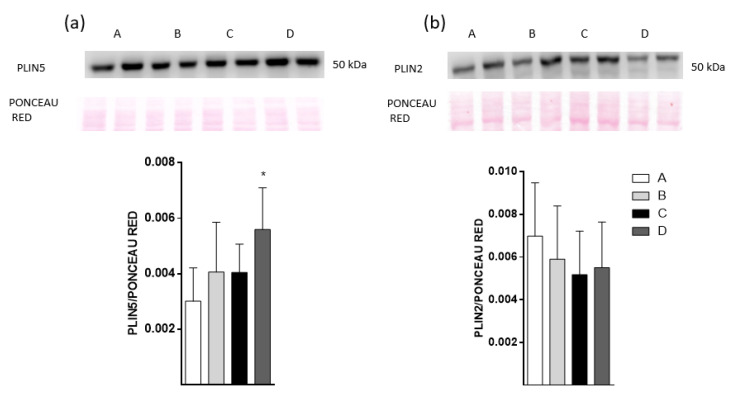
Figure 5.
Perilipin levels in freshly isolated hepatocytes from high-fat diet (HFD)-fed mice. Animal groups were fed with HFD and divided into four groups. Oral oil administration: A, sunflower oil; B, DSO; C, CDSO concentrated by urea complexation and D, CPUFA Salmon oil concentrated by urea complexation. Lysates from isolated hepatocytes were used to determine Plin5 (a) and Plin2 (b) protein levels by Western blot. The top image shows the original gel plus the respective Ponceau red stain, and the bottom image shows the densitometric analysis. Data are presented as mean ± SEM; * p < 0.05, by one-way analysis of variance (ANOVA) followed by Tukey post hoc test.

