
Figure 10.
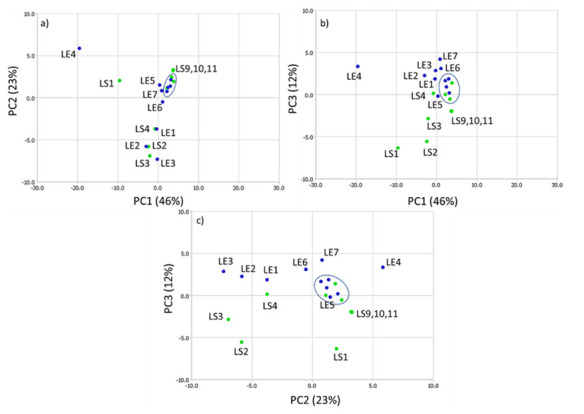
Score plots of principal component analysis of Aronia extracts: (a) PC1 versus PC2 score, (b) PC1-versus PC3 score, (c) PC2-versus PC3 score. Green points—the farm from central Poland, blue points—higher altitude location. On each plot, circled points correspond to ripe fruits.