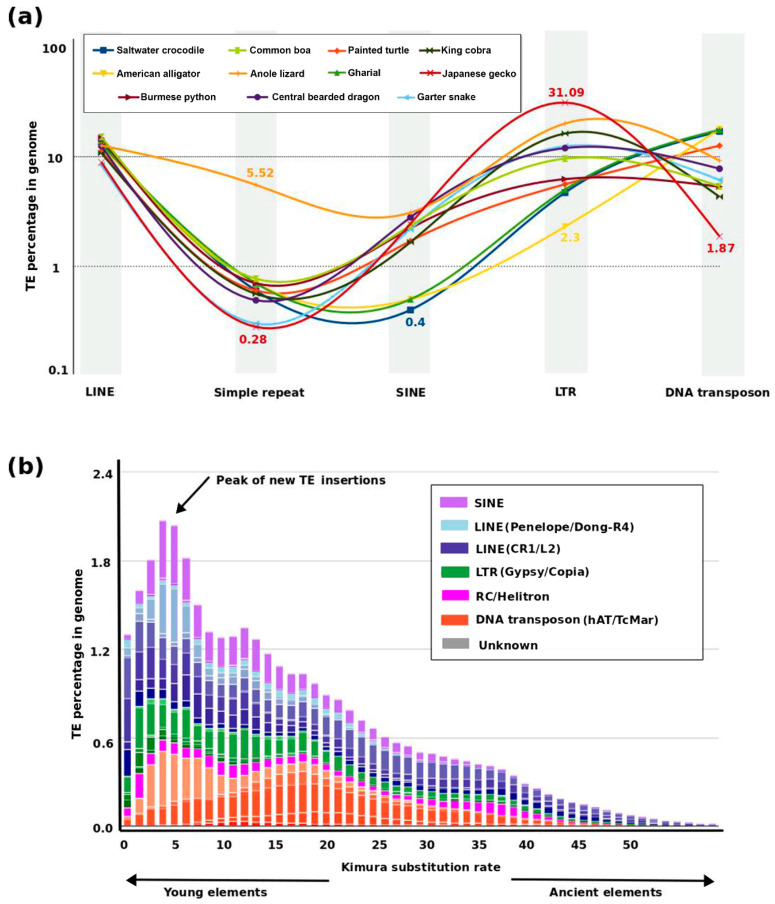
Figure 3.
Genomic proportion of repeats in reptiles. (a) Comparative line plot of major repeat elements in 11 representative species. The proportion of LINEs is similar for each species, whereas Anolis shows the highest abundance of simple repeats. LTRs are most abundant in gecko and least abundant in alligator. Crocodile, gharial, and alligator show similarly low abundance of SINEs. The X-axis has no intrinsic meaning for variable values and is given to represent the types of repeats only. A bar graph of the same data is provided as Supplementary Figure S1. (b) Transposable element (TE) evolutionary landscape of the Anolis genome. The y-axis and x-axis represent genomic proportion (%) and Kimura divergence, respectively. A recent wave of transposition in the Anolis genome has occurred, as indicated by the black arrow and very low proportions of old elements. K values from 1 to 50 denote evolutionary divergence from younger to older repeats. Data for the percentage of repeat elements was sourced from the literature and the RepeatMasker database (http://www.repeatmasker.org/genomicDatasets/RMGenomicDatasets.html, last accessed, June 2020). The Anole TE landscape was retrieved from RepeatMasker and manually annotated and edited using Inkscape V 0.92 (https://inkscape.org/release/inkscape-0.92/).

