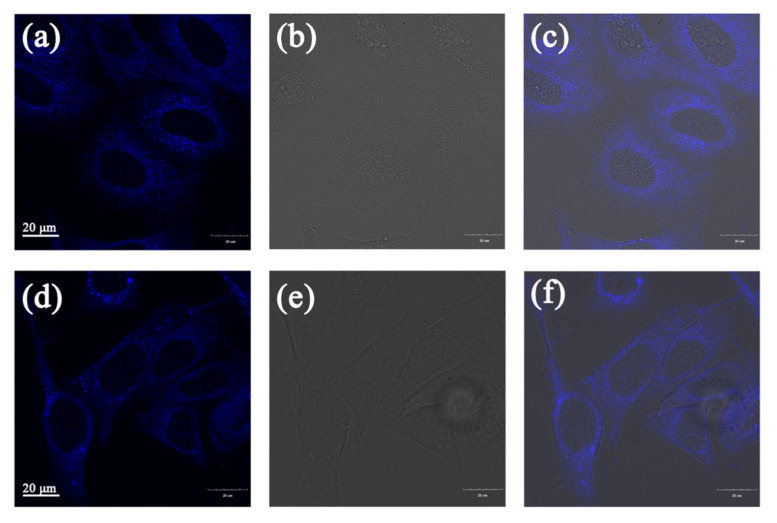
Figure 6.
(a) The fluorescence image of compound 1 in A549 cells. (b) The bright-field image. (c) The merge image of (a) and (b). (d) The fluorescence image of compound 2 in A549 cells. (e) The bright-field image. (f) The merge image of (e) and (f). The excitation wavelength was 359 nm. The collected wavelength range was 430–480 nm.

