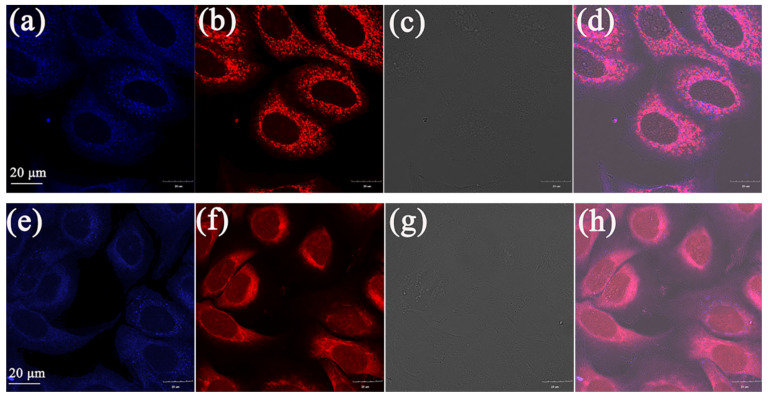
Figure 7.
Co-localized images of A549 cells incubated with (a) 1, (e) 2 (10 μM) for 30 min and Mito Tracker Red (200 nM) (b), (f) for 15 min. The bright-field image of A549 cells stain with (c) 1, (g) 2. The merged image stained with (d) 1, (h) 2. The excitation wavelength of compound 1 and 2 was 359 nm and the collected wavelength range was 430–480 nm. The excitation wavelength of Mito Traker Red was 578 nm and the collected wavelength range was 570–620 nm.

