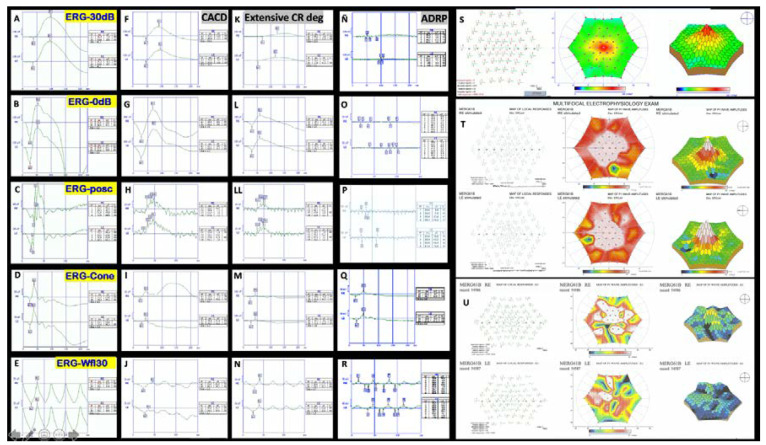
Figure 7.
Examples of ERGs. On the left-hand side is a normal ffERG from F8-II-2 (A–E), and next to it the ffERG shows the decreased photopic and scotopic amplitude in patient F5c-IV-4 with CACD (F–J). Amplitudes of the b-wave are even lower in a case from F2-III-6 with extensive chorioretinal degeneration (K,L,LL,M,N). Finally, the ffERG of a case from F7-III-1 with autosomal dominant retinitis pigmentosa (ADRP) shows a flat scotopic and photopic ffERG (Ñ,O,P,Q,R). On the right-hand side, the image at the top shows a normal multifocal ERG above (S), the ERG from the F3-V-2 patient showing some areas of decreased P1 wave amplitude is in the middle (T), and a case from F2-III-6 with ECA showing generalized decrease of the P1 wave amplitude is at the bottom (U).

