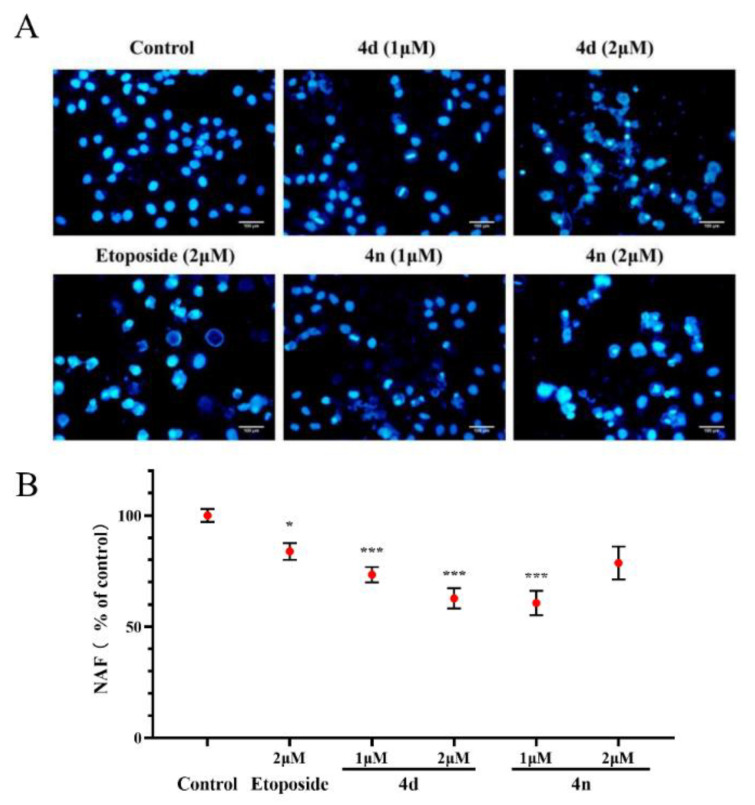
Figure 7.
Morphological observation on A549 cells by DAPI staining. (A) DAPI staining of A549 cells treated with 4d and 4n (1 μM, 2 μM), with etoposide (2 μM) as a comparative control. (B) Morphological alterations were semi-quantification by NAF calculated by the product of nuclear area and circularity. Values (% of control) were presented as means ± SD (n = 3), labeled with * p < 0.05 or with *** p < 0.001 compared with the control group (Student’s t-test). Scale bar: 100 µm.

