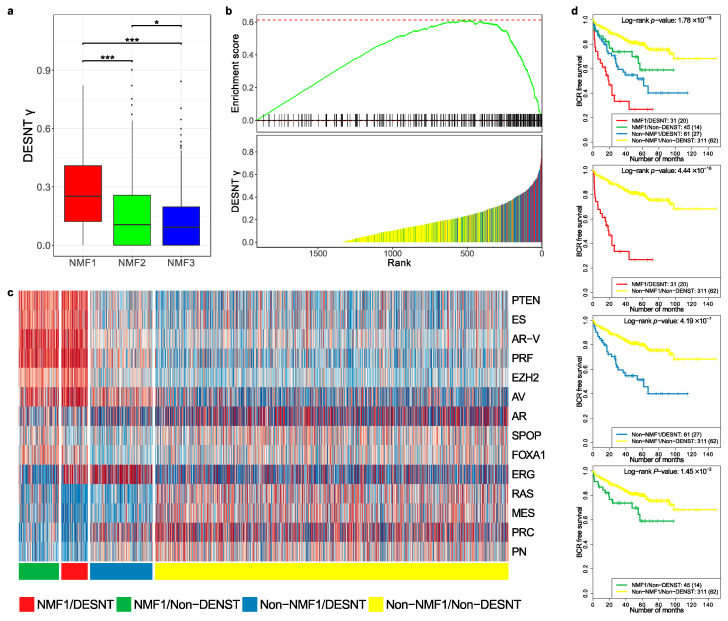
Figure 4.
Comparison of DESNT and non-negative matrix classifications. (a) Distribution of DESNT γ for cancers assigned to NMF1, NMF2 and NMF3. (b) Gene Set Enrichment Analysis. Cancers were ranked according to DESNT γ (Lower Panel). The enrichment for cancers assigned to the NMF1 high-risk group (vertical lines) is shown (Upper Panel). (c) Pathway activation profiles for each cancer arranged according to DESNT and NMF1 subgroup status. The key is shown at the bottom of the figure. (d) Kaplan–Meir plots for the different cancer categories. The outcome used is time to biochemical recurrence post prostatectomy. * ≤0.05; ** ≤0.01; *** ≤0.001.

