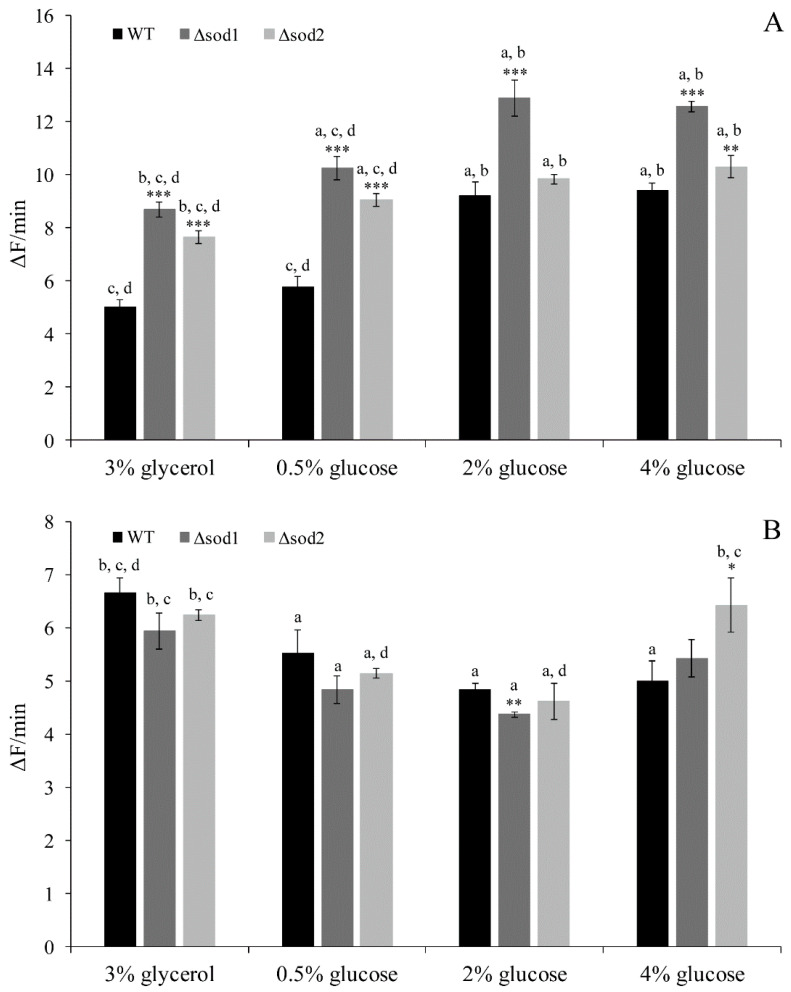
Figure 2.
The reactive oxygen species (ROS) content in the WT strain, Δsod1 and Δsod2 mutants cultivated in medium with 3% glycerol or different glucose concentration was estimated by the rate of fluorescence increase due to dihydroethidium (DHET) (A) and 2’,7’-dichlorodihydrofluorescein (H2DCF) (B) oxidation within cells. Data are presented as mean ± SD from three independent experiments. * p < 0.05, ** p < 0.01, *** p < 0.001 as compared to the WT strain; a—different from medium with 3% glycerol, b—different from medium with 0.5% glucose, c—different from medium with 2% glucose, d—different from medium with 4% glucose.

