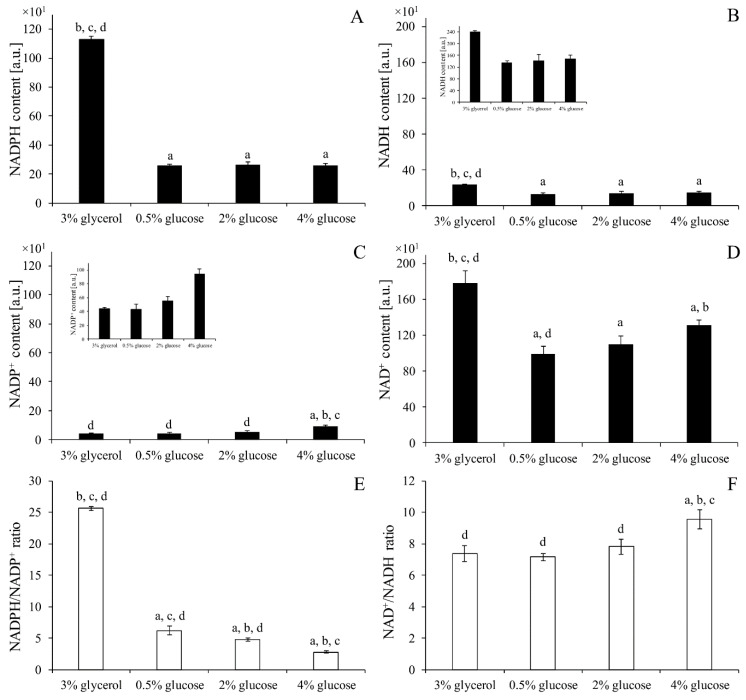
Figure 6.
The content of individual pyridine nucleotide cofactors NADPH (A), NADH (B), NADP+ (C), NAD+ (D) was assessed in the cells WT strain cultivated in medium with 3% glycerol or different glucose concentration. NADPH/NADP+ (E) and NAD+/NADH (F) ratios were also calculated. Data are presented as mean ± SD from three independent experiments. a—different from medium with 3% glycerol, b—different from medium with 0.5% glucose, c—different from medium with 2% glucose, d—different from medium with 4% glucose.

