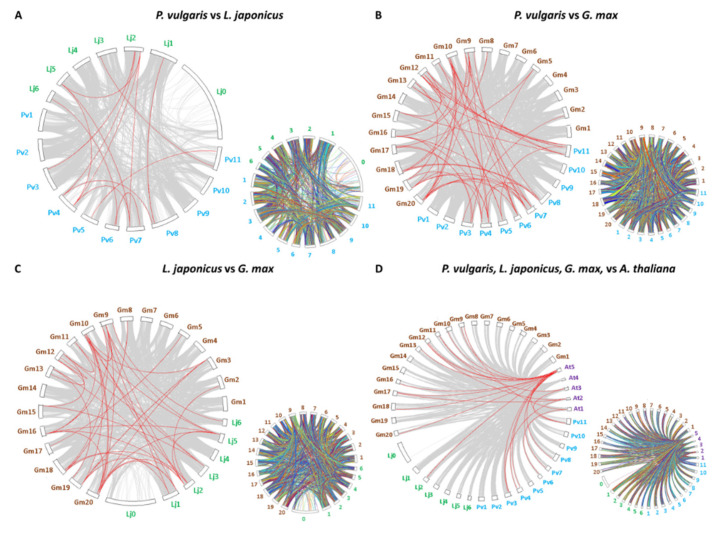
Figure 3.
Synteny of the CrRLK1L genes in P. vulgaris, L. japonicus, G. max, and A. thaliana. MCScan software was used to analyze the syntenic correlation between species. (A) Synteny map of CrRLK1Ls between L. japonicus and P. vulgaris. (B) Synteny map of CrRLK1Ls between G. max and P. vulgaris. (C) Synteny map of CrRLK1Ls between L. japonicus and G. max. (D) Synteny map of CrRLK1Ls between A. thaliana and the three legumes examined. Chromosome numbers are indicated outside each figure as follows: in turquoise, P. vulgaris; in green, L. japonicus; in brown, G. max; and in purple, A. thaliana. The smaller synteny maps to the right of each image represent the synteny of all the genes in the genomes compared here.

