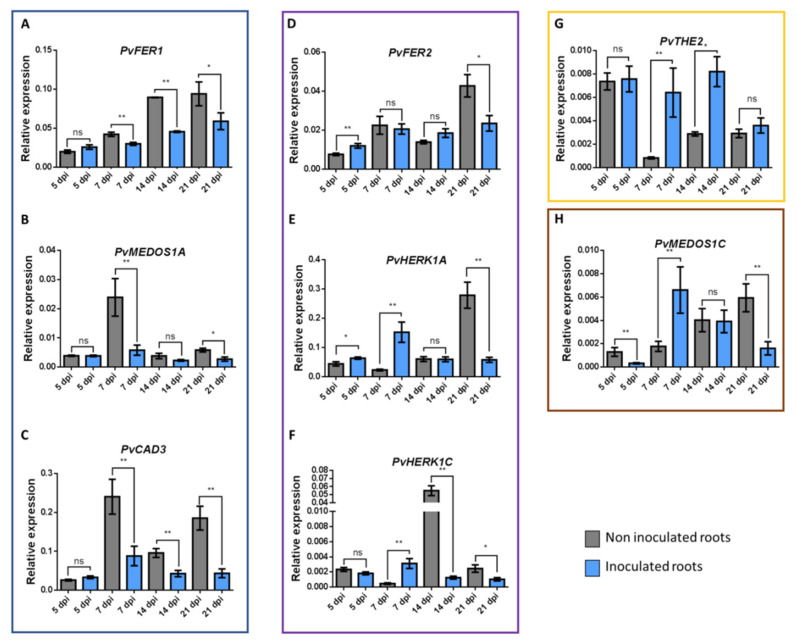
Figure 6.
RT-qPCR expression analysis of eight P. vulgaris CrRLK1L genes. Relative expression profiles of eight CrRLK1L genes from P. vulgaris roots inoculated or not with R. tropici. Genes were classified into four groups according to their expression; the blue box indicates downregulated genes at the early and late time points: PvFER1 (A), PvMEDOS1A (B), and PvCAD3 (C); the purple box shows genes whose expression is upregulated at the early time points assessed, but downregulated later on: PvFER2 (D), PvHERK1A (E), and PvHERK1C (F); the yellow box indicates the expression of PvTHE2 (G), which was upregulated at the early and late time points; and the brown box displays PvMEDOS1C (H), showing variable expression at the different time points evaluated. The transcript accumulation of the selected genes was assessed by RT-qPCR and normalized according to elongation factor 1α (ef1α) gene expression. Blue bars represent inoculated roots, whereas gray bars indicate the expression levels in non-inoculated roots. The error bars represent standard deviation of the mean (n = 6). A Student’s t-test was performed to evaluate significant differences, * represents p ≤ 0.05, ** represent p ≤ 0.01, ns represents non-significant difference.

