
Figure 4.
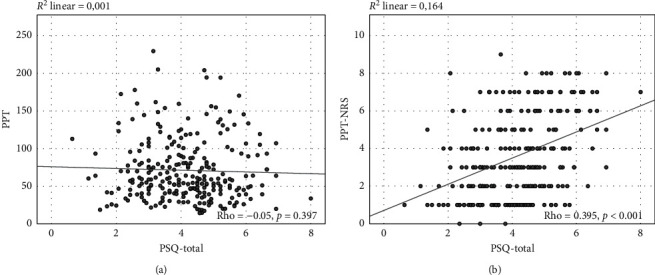
Illustration of the correlations between total score of the Pain Sensitivity Questionnaire (PSQ) and results of experimental pressure pain testing. (a) Correlation between the total score of PSQ (PSQ-total) and the pressure pain threshold (PTT). (b) Correlation between the total score of PSQ (PSQ-total) and the pressure pain threshold numerical rating scale (PTT-NRS). Linear regression lines are displayed, and Spearman's correlation coefficients (rho) as well as p values are given (n = 262).