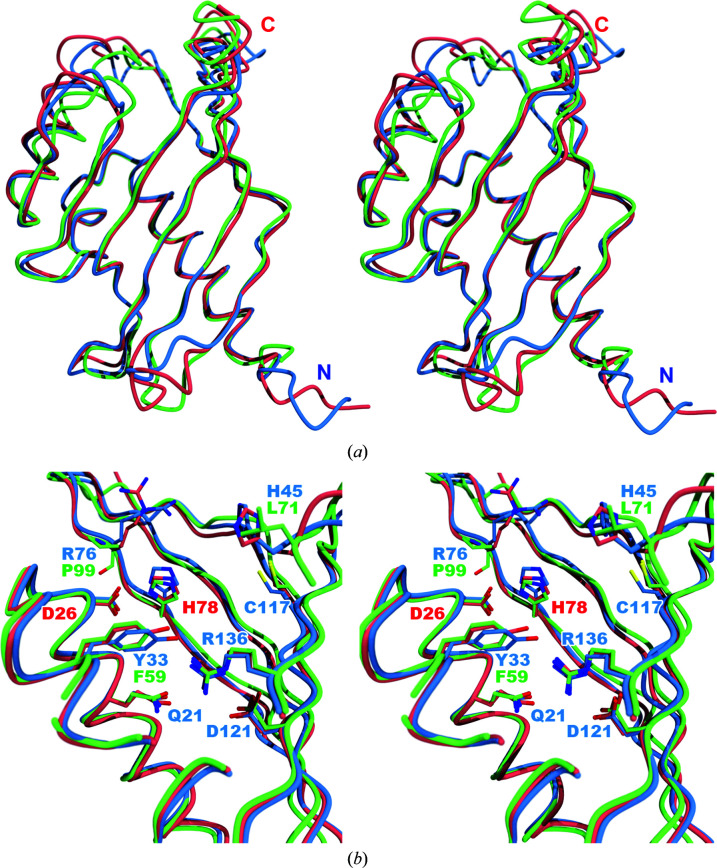
Figure 3.
(a) Stereoview of the superimposed Cα traces of ActVI-ORFA (blue), Caci_6494 (salmon) and Aln2 (green). Least-squares fitting was performed using Secondary Structure Matching (SSM) as implemented in Coot. (b) Overlay of the putative active sites of ActVI-ORFA (blue), Caci_6494 (salmon) and Aln2 (green). Labels for the side chains of the putative active-site residues in ActVI-ORFA are displayed in blue; those residues that differ in Aln2 are shown in green. The His/Asp dyad is labelled in red. This figure was created using the POVScript+ modification of MolScript and POV-Ray.

