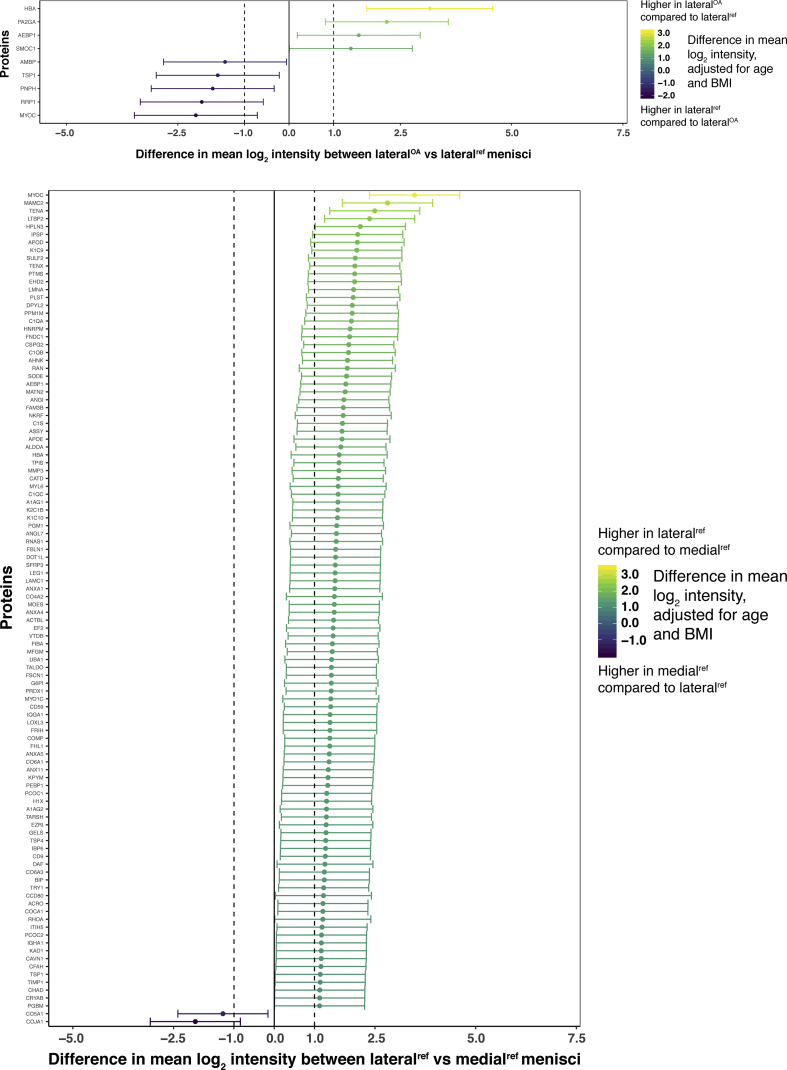
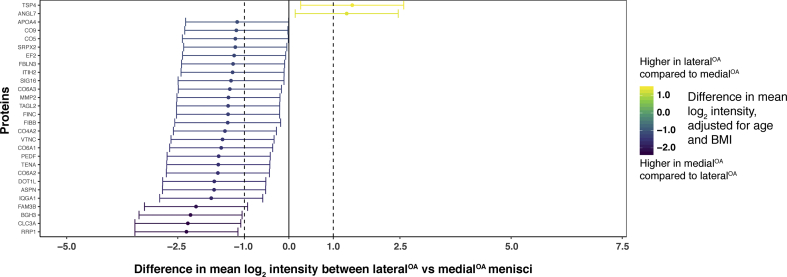
Fig. 3.
Visual representation of differentially expressed proteins (y-axis) in A) medialOA vs medialref menisci, B) lateralref vs medialref menisci, C) lateralOA vs medialOA menisci and D) lateralOA vs lateralref menisci. Log2-transformed mean intensity differences are displayed as point estimates with 95% confidence intervals as error bars (x-axis). The color of the point estimates and error bars represents the difference in log2 mean intensity between the groups, according to the scale bar on the right.


