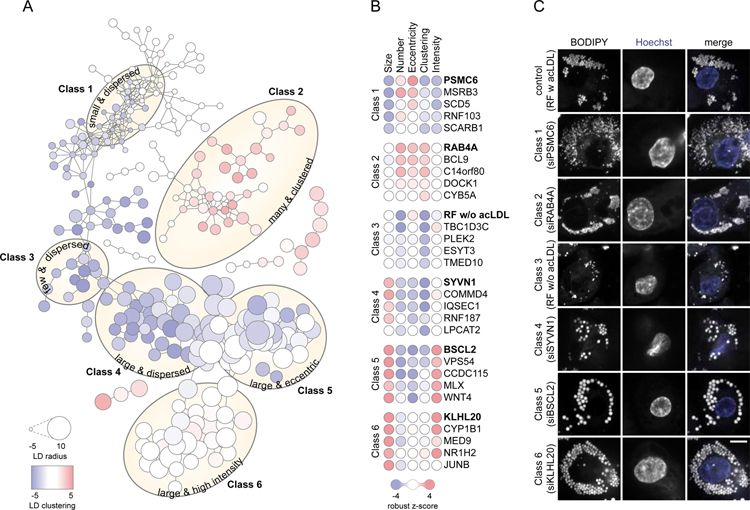
Figure 2. Genetic Determinants of Lipid Storage Belong to Six Major Classes.
(A) RNAi screen hits cluster into six major classes. Based on pair-wise similarities derived from Spearman’s rank correlation, RNAi screen hits were interconnected by edges into major classes as indicated by yellow ellipses. Each node represents a hit and its size and color are proportional to the robust z-score of the hit for LD radius and LD clustering, respectively. Data are also available as an interactive tree view file, see Data S1.
(B–C) Representative hits for classes 1–6. (B) For each class, five hits are visualized as nodes where the color of each circle is proportional to the robust z-score of the hit. (C) Confocal images displaying LDs (stained by BODIPY) and nuclei (stained by Hoechst) of a representative hit for each class. Scale bar, 5 µm.

