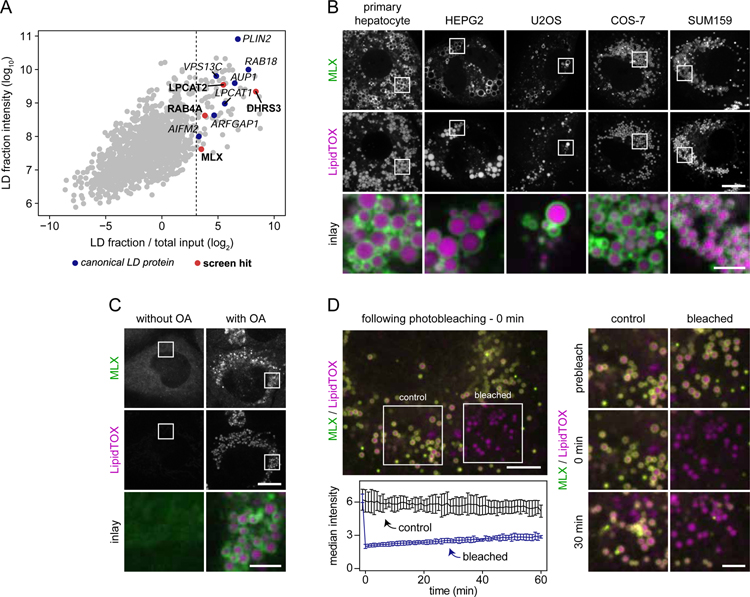
Figure 3. Transcription Factor MLX Is an LD Protein.
(A) Identification of macrophage LD proteins in THP-1 macrophages. Proteins localized to LDs in THP-1 macrophages incubated with oleic acid (0.5 mM) for 6 hours were identified by mass spectrometry. For each protein, intensities in whole-cell lysate and LD fractions were compared. Known LD proteins were used to calculate a fold-change cut-off (for LD enrichment) based on the 99% confidence interval of their distribution (lower boundary is indicated by the dashed line). Results from one representative experiment are shown.
(B) MLX localizes to LDs in multiple cell types. Representative confocal images of mouse primary hepatocytes, HEPG2, U2OS, COS-7, and SUM159 cells transfected with GFP-tagged MLX. Cells were incubated with oleic acid (0.5 mM) for 1 day, stained with LipidTOX Deep Red and thereafter imaged. Scale bars, 10 µm and 2.5 µm (inlay).
(C) Endogenously tagged MLX targets to LDs. MLX was endogenously tagged C-terminally with EGFP using CRISPR/Cas9-mediated engineering in SUM159 cells. Representative images of the localization of MLX in live cells incubated in the presence or absence of oleic acid (0.5 mM) for 1 day are shown. LDs were stained prior to imaging using LipidTOX Deep Red. Scale bars, 10 µm and 2.5 µm (inlay).
(D) Stable binding of MLX to LDs. After transfection with EGFP-tagged MLX, oleation (0.5 mM) for 1 day and staining of LDs with LipidTOX Deep Red, LD-binding properties of MLX were tested using fluorescence recovery after photobleaching. Representative examples of a cell and inlay images are shown in the upper left and right panels, respectively. Recovery kinetics of MLX was quantified from three independent experiments as highlighted in the lower left panel. Scale bars, 5 µm and 2.5 µm (inlay). Abbreviation: OA, oleic acid.

