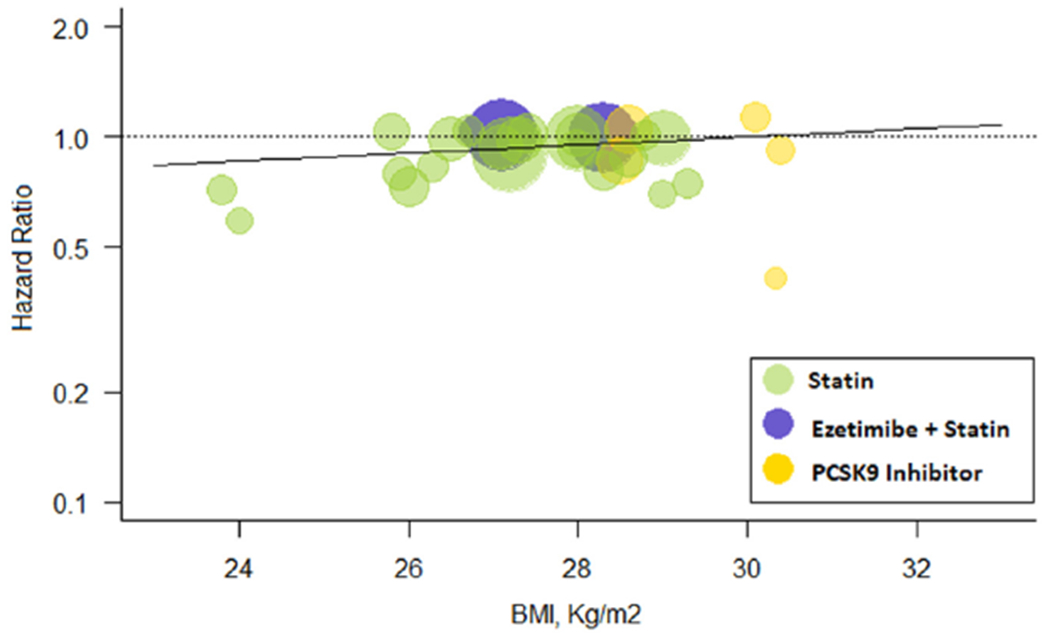
Figure 4.

Meta-regression for BMI effect on all-cause mortality. Change in hazard ratios and 95% confidence intervals for all-cause mortality plotted against body mass index (BMI, kg/m2). Size of the data marker is proportional to the weight in the meta-regression. Data marker colors represent the classes of lipid-lowering agents used in the active treatment group as per trial randomization design. The solid line represents the meta-regression slope of the change in hazard ratio for treatment across BMI values.
