
Figure 17.
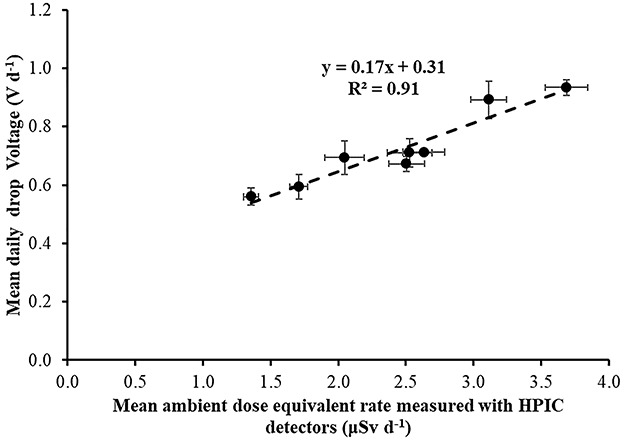
Correlation between mean (for all time periods) daily electret potential lowering (in Volts) with the mean daily ambient dose equivalent, measured with HPIC detectors in the eight locations.
Official websites use .gov
A
.gov website belongs to an official
government organization in the United States.
Secure .gov websites use HTTPS
A lock (
) or https:// means you've safely
connected to the .gov website. Share sensitive
information only on official, secure websites.
Correlation between mean (for all time periods) daily electret potential lowering (in Volts) with the mean daily ambient dose equivalent, measured with HPIC detectors in the eight locations.