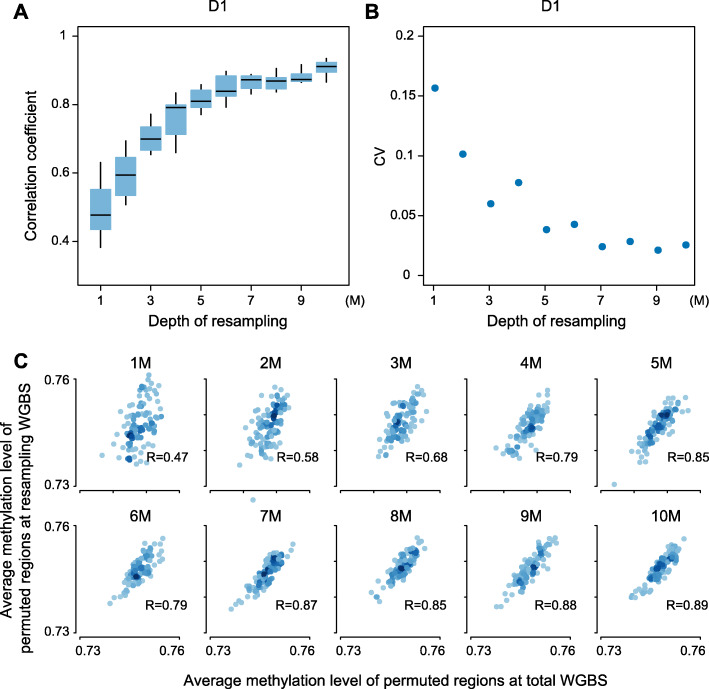
Fig. 2.
Efficacy of a low-pass sequencing strategy illustrated by resampling reads in healthy individual. a The boxplot shows the correlation coefficient between resampling low-pass WGBS and total sequencing reads for 10 times from 1 M to 10 M. b The coefficient of variation (CV) for 10 correlation coefficient between resampling low-pass WGBS and total sequencing reads from 1 M to 10 M. c The correlation between average methylation level of permutated regions at resampling reads and average methylation level of permutated regions at total sequencing reads from 1 M to 10 M for one time

