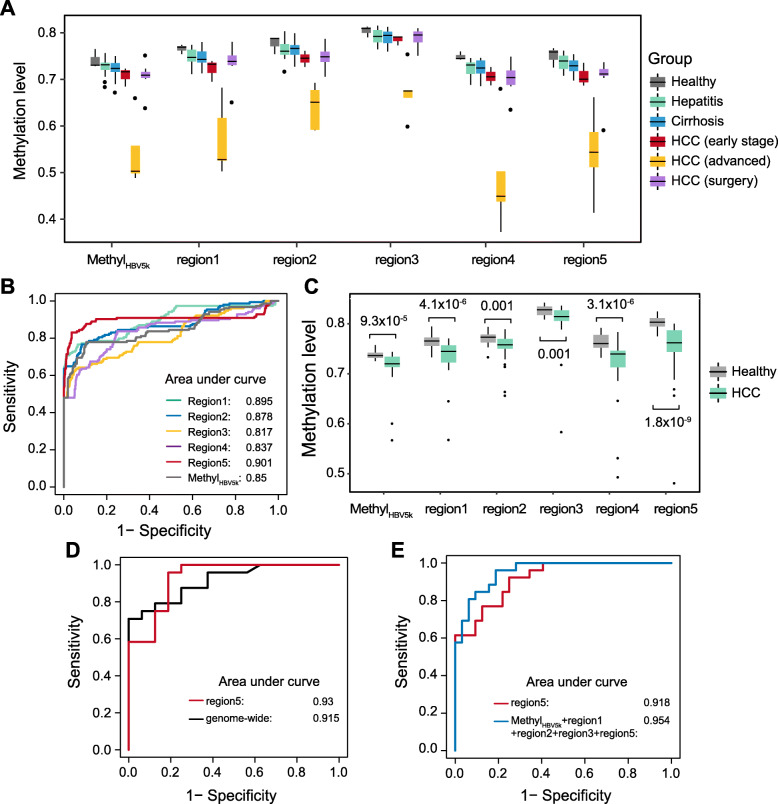
Fig. 4.
Hypomethylation around HBV integration regions aid HCC prediction. a Boxplot displays MethylHBV5k and the methylation level of top 5 selected regions in all the 54 samples. b Receiver operating characteristics (ROC) curve based on fivefold cross-validation for HCC detection by different indicators in discriminating HCC patients from individuals without HCC (healthy individuals, patients with hepatitis and cirrhosis). c The comparisons between healthy individuals and patients with early-stage HCC using MethylHBV5k and the methylation level of top 5 selected regions in the validation dataset. d ROC curves for 16 healthy individuals and 24 HCC patients in the validation cohort using genome-wide hypomethylation analysis and region 5. e ROC curves for HCC patient detection using all the healthy individuals and HCC patients in the validation cohort by the identified features

