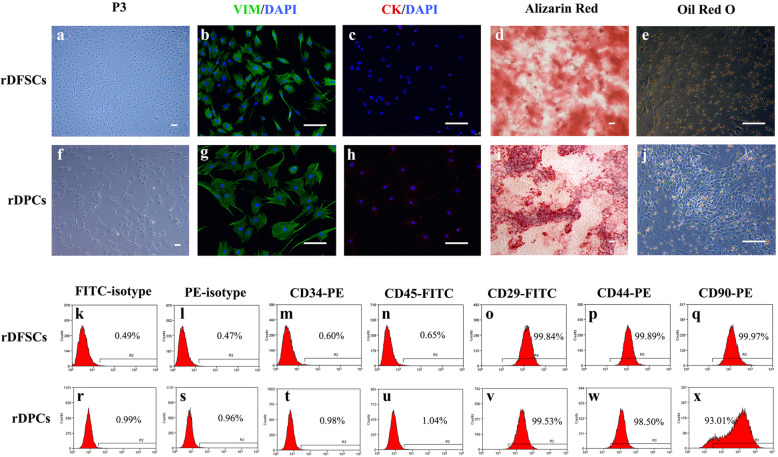
Fig. 1.
Isolation and identification of rDFSCs and rDPCs. Representative images of rDFSCs (a) and rDPCs (f). rDFSCs and rDPCs were both positive for vimentin (b, g) and negative for cytokeratin (c, h). After osteogenic induction for 14 days, mineralized nodules were detected in rDFSCs (d) and rDPCs (i) by Alizarin Red staining. After adipogenic induction for 14 days, lipid droplets were detected in rDFSCs (e) and rDPCs (j) by Oil Red O staining. Scale bar 100 μm. Representative flow cytometric results showed the expression pattern of CD markers in P3 rDFSCs (k–q) and rDPCs (r–x)

