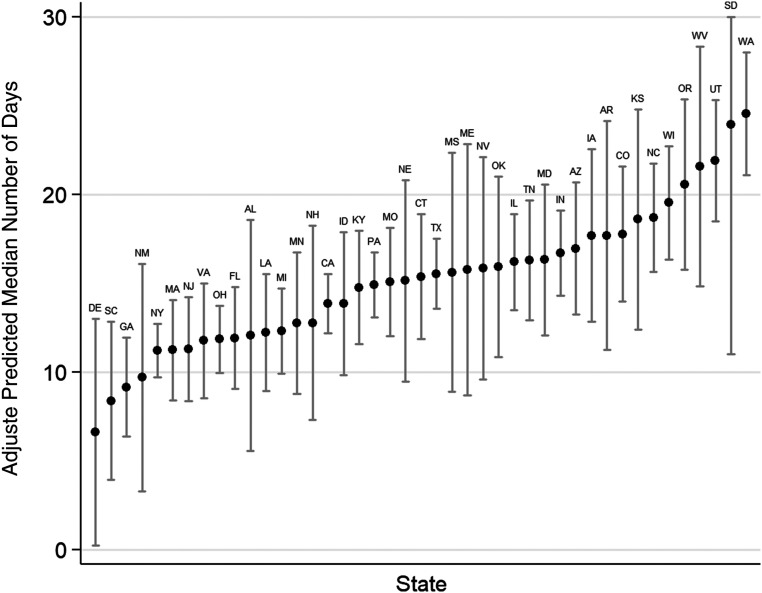
FIGURE 2.
Adjusted predicted median number of days of home nursing among recipients by state (among states with at least 20 observations). The widths of the 95% CIs are largely due to the sample size in each state, with smaller states having wider CIs. Values for the adjusted 95% CIs <0 have been truncated.

