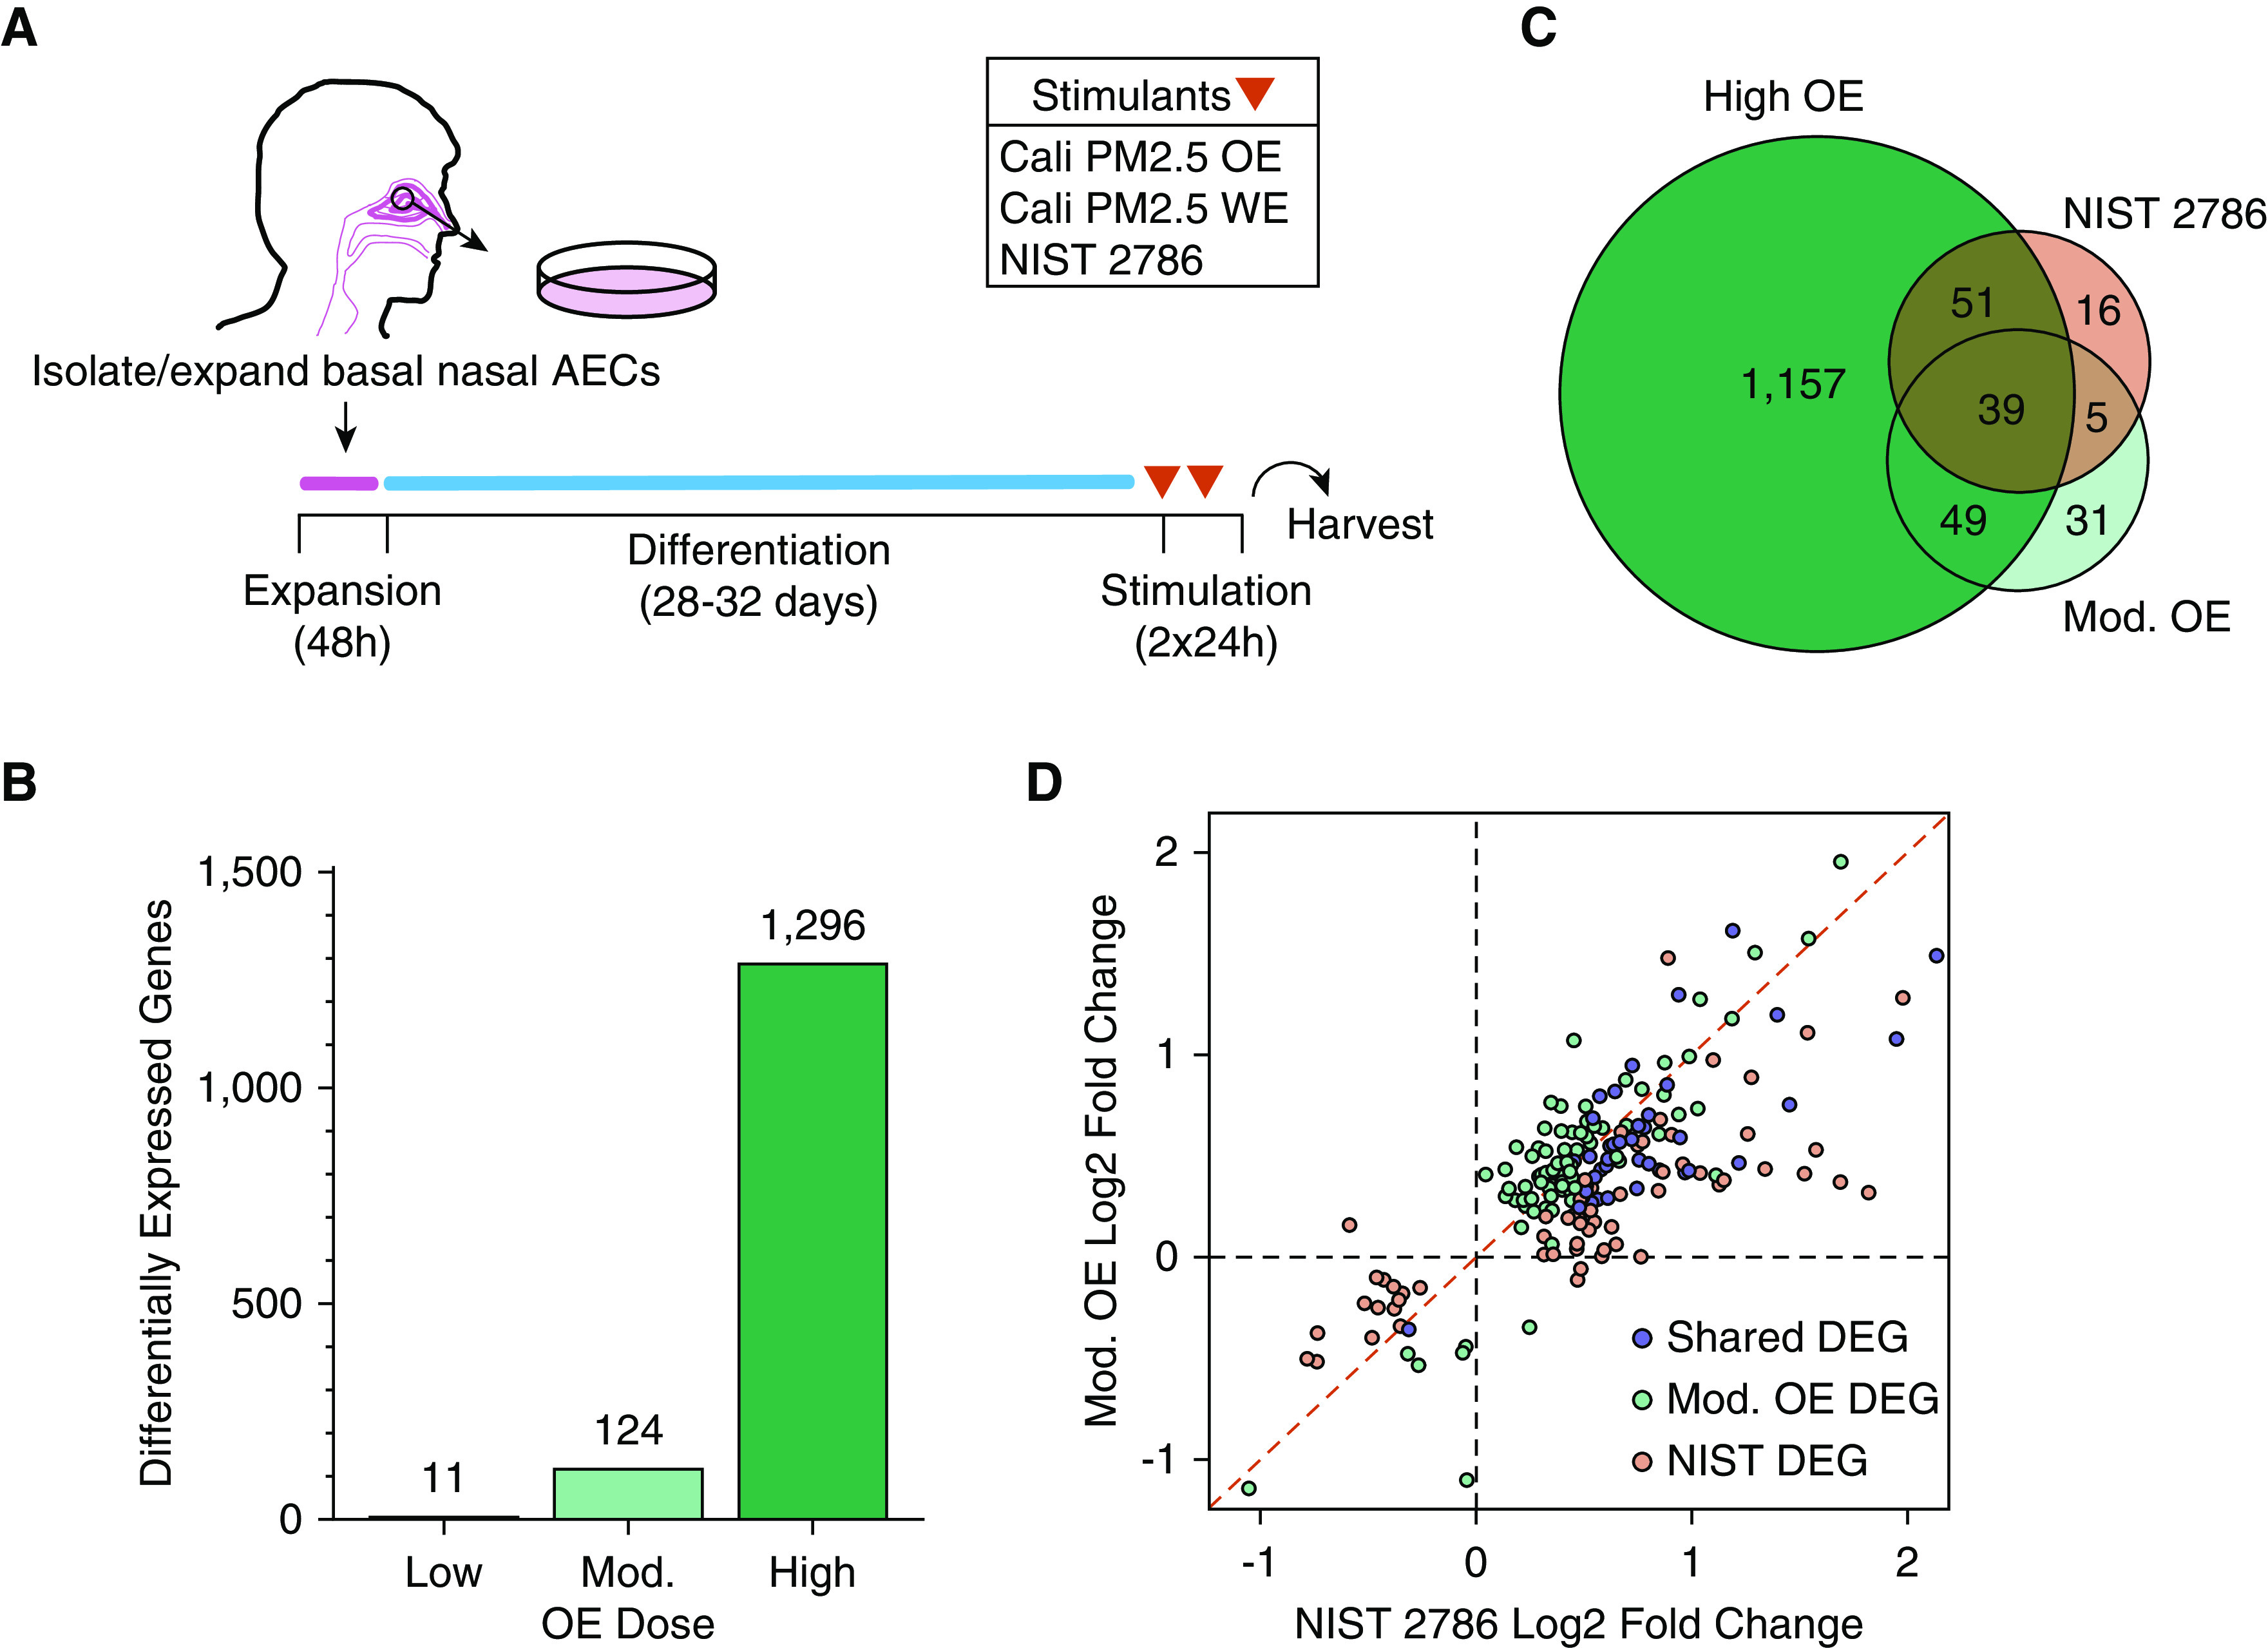
Figure 2.

OE drives the airway epithelial response to PM2.5 stimulation. (A) Schematic of experimental design starting from isolation of nasal airway epithelial cells (AECs) to mucociliary air–liquid interface culture differentiation and acute (48 h) stimulation with PM2.5 extracts (Cali PM2.5) or National Institute of Standards and Technology (NIST) 2786. (B) Number of differentially expressed genes (DEGs) after stimulation with three separate PM2.5 OE doses. (C) Venn diagram showing shared and unique DEGs across moderate (Mod.) OE dose, high OE dose, and NIST 2786. (D) Comparison of effect sizes between the union of DEGs from moderate OE and NIST 2786 stimulations.
