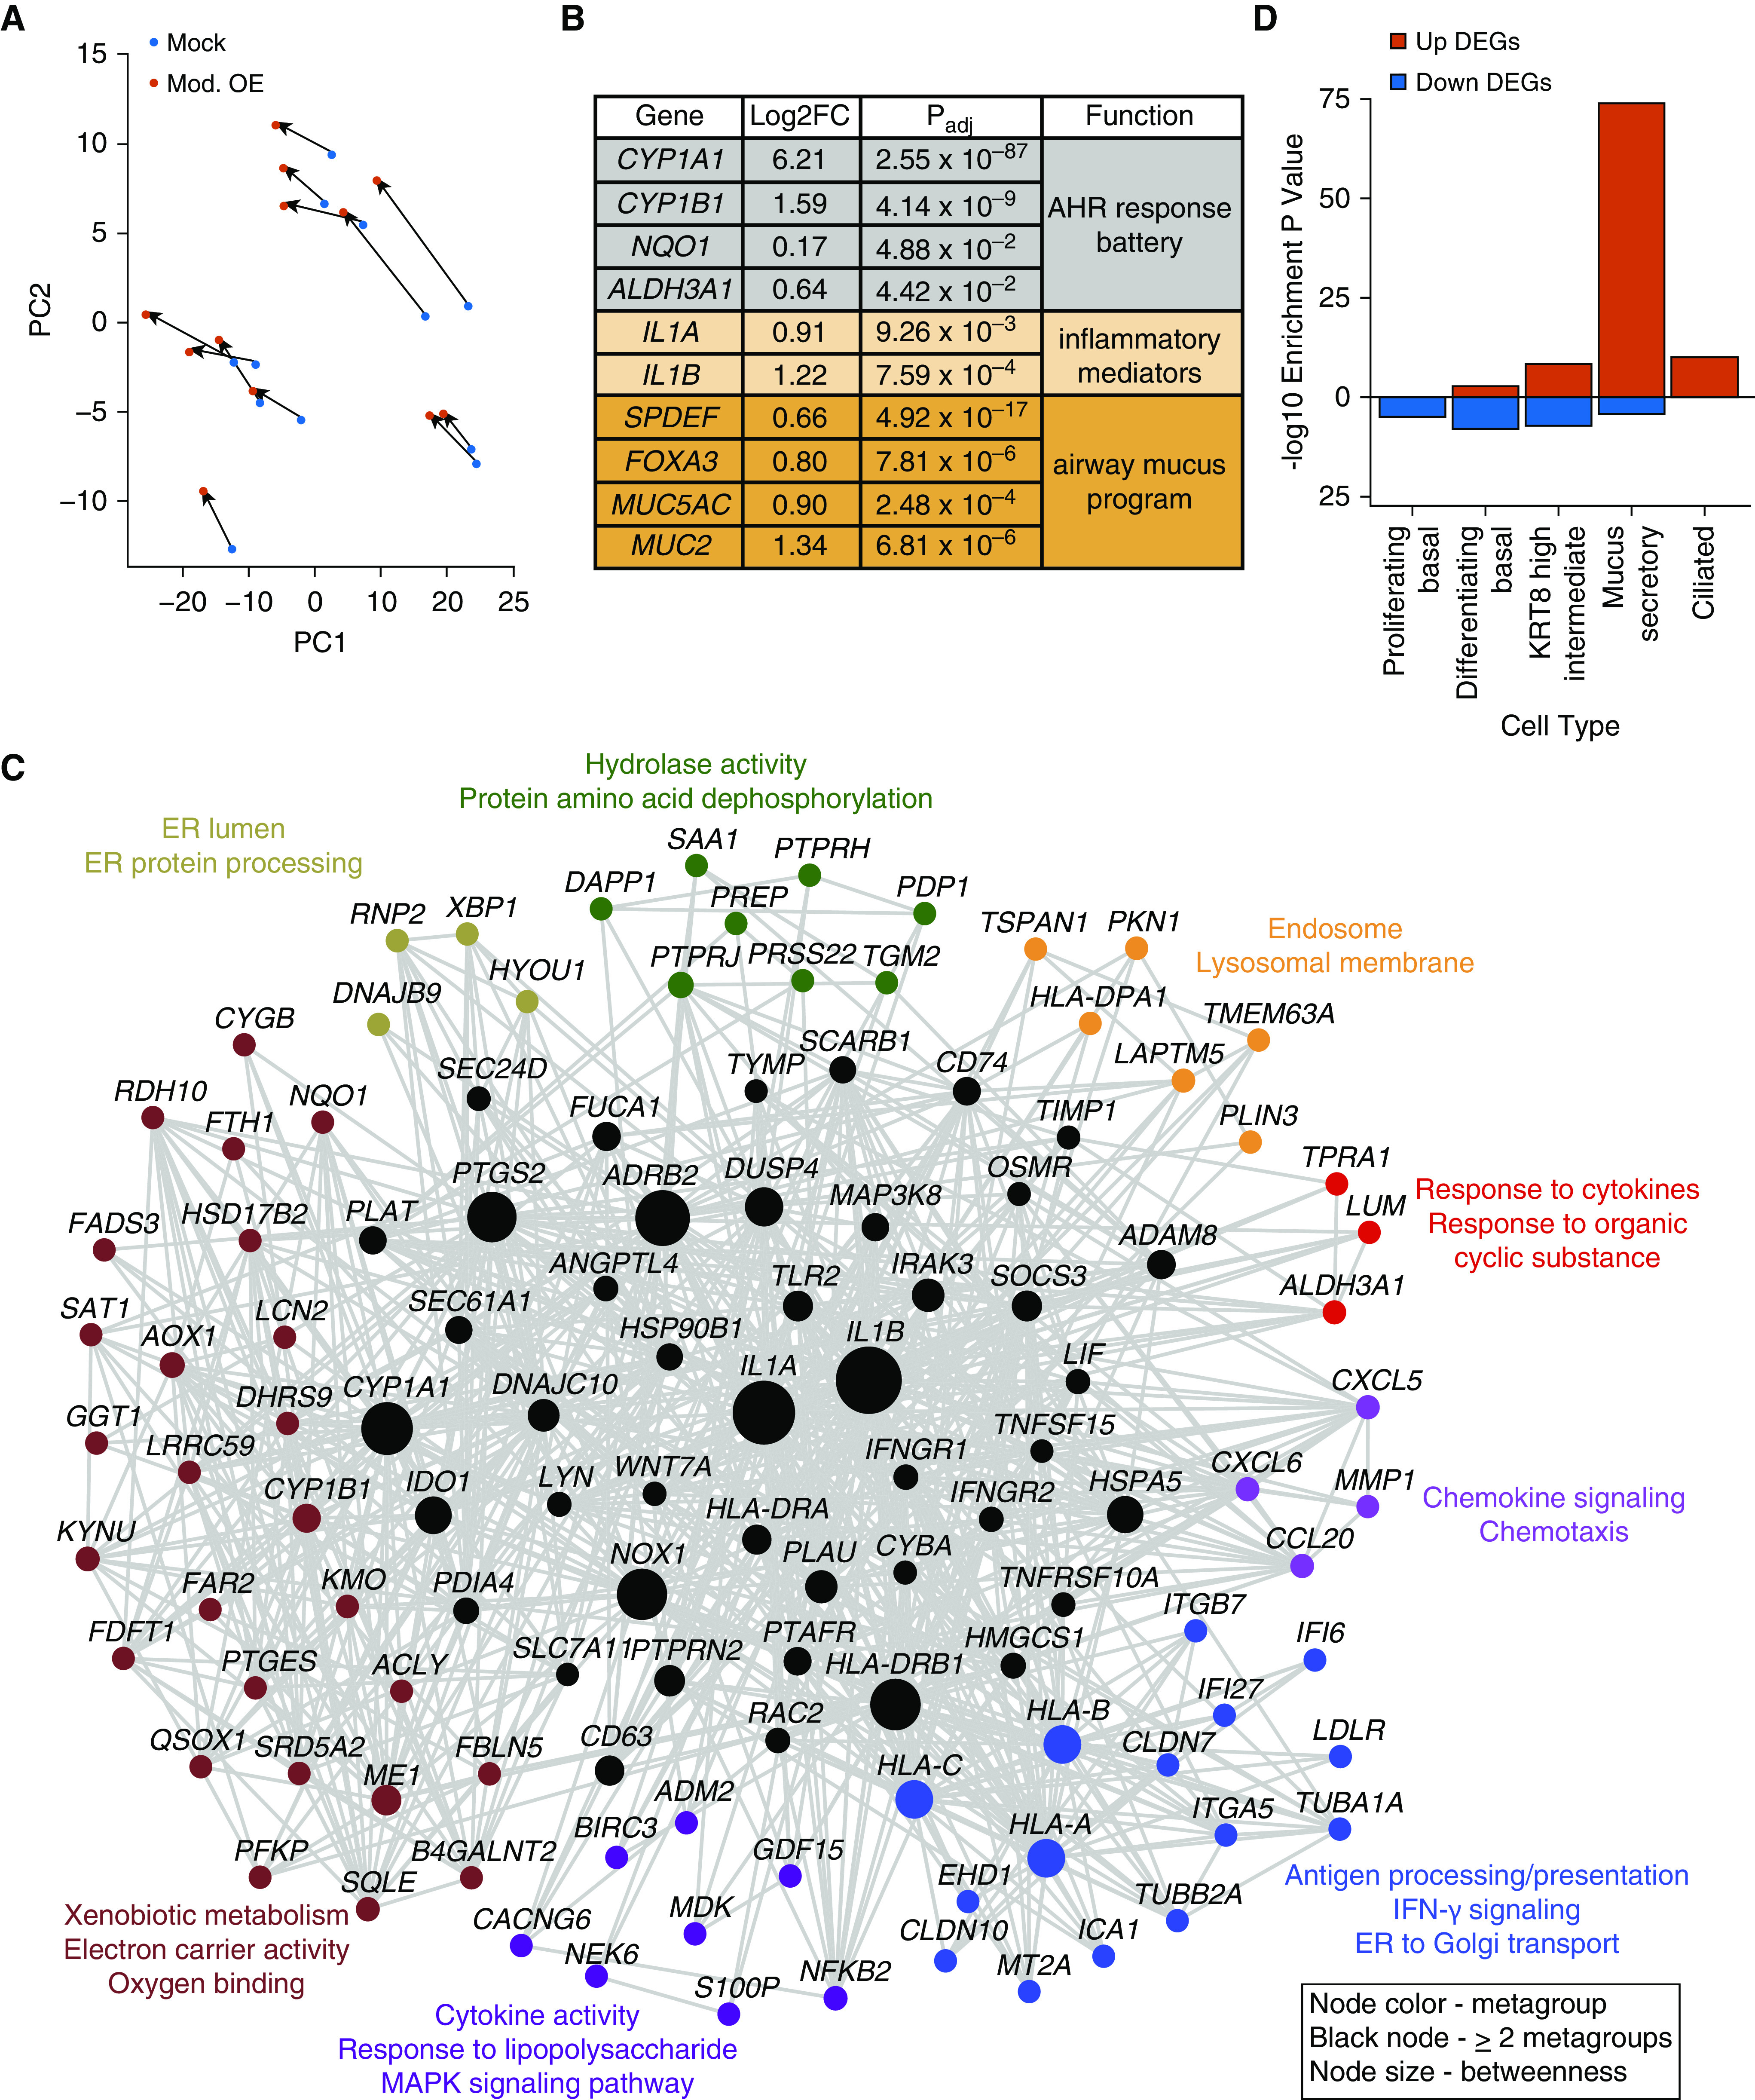
Figure 3.

PM2.5 OE stimulates an inflammatory network that induces a mucus secretory cell program. (A) Principal component (PC) analysis on 424 DEGs from moderate OE and mock comparison. (B) Table of select DEGs induced by moderate OE stimulation. (C) Functional gene network of moderate OE-upregulated DEGs. Node colors refer to metagroup membership, and black nodes represent genes shared between two or more metagroups. Node size represents betweenness across entire network. (D) Enrichment of moderate OE DEGs for cell type–specific marker genes. AHR = aryl hydrocarbon receptor; ER = endoplasmic reticulum.
