Figure 4.

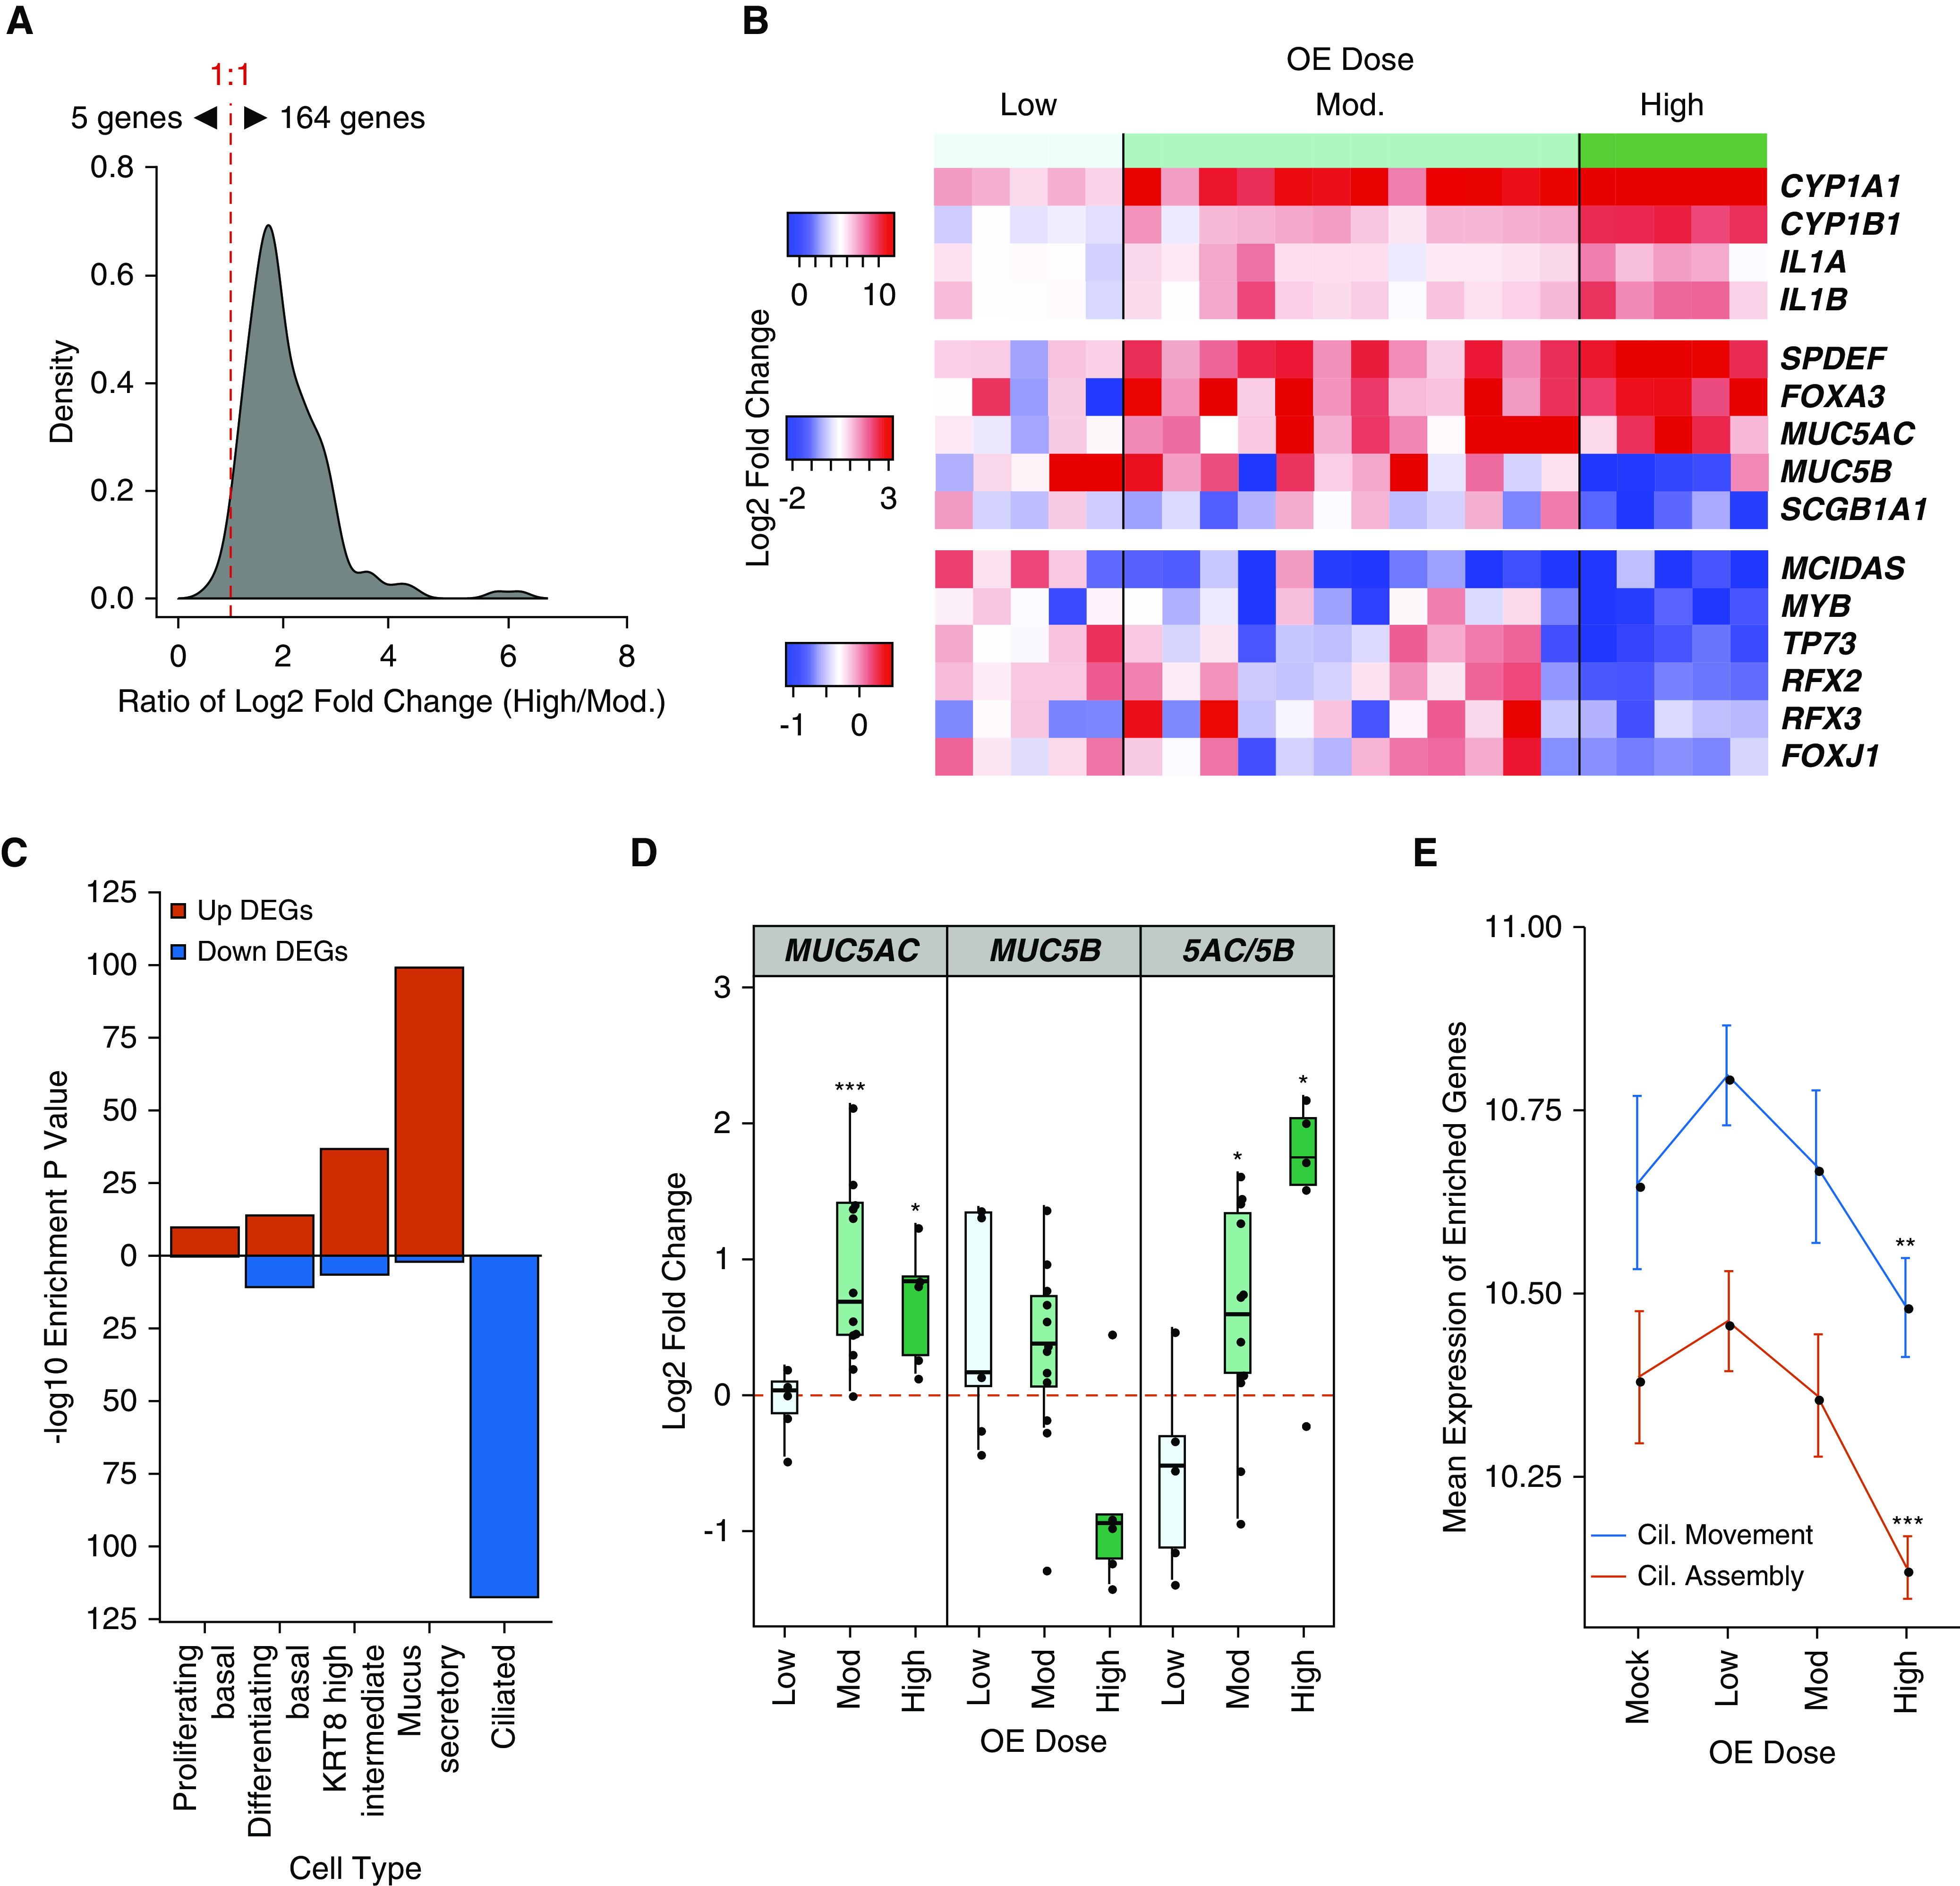
High OE dose induces transcriptional remodeling of the airway epithelium. (A) Histogram of the ratio of log2 fold change (High/Mod.) for shared upregulated DEGs between moderate and high OE dose stimulation. (B) Heat map of the log2 fold change in expression between mock and OE dose-stimulated donor culture pairs (columns) for key response genes across OE dose. (C) Strength of enrichment for high OE dose DEGs within groups of cell type–specific marker genes. (D) First and second panels: log2 fold change of MUC5AC (mucin 5AC) and MUC5B (mucin 5B) across OE dose (*Padj < 0.05, and ***Padj < 0.001); third panel: ratio of log2 fold changes (MUC5AC/MUC5B). Statistically significant differences in ratio compared with mock-treated cultures (*P < 0.05) were determined by two-tailed, paired t test. (E) Mean expression of cilia (Cil.) assembly and cilia movement genes across mock and OE dose. Statistically significant differences in module gene expression between mock and OE dose (**P < 0.01 and ***P < 0.001) were determined by two-tailed, paired t test. For all plots, mock and moderate OE, n = 12 independent donors; low and high OE, n = 5 independent donors.
