
Figure 5.
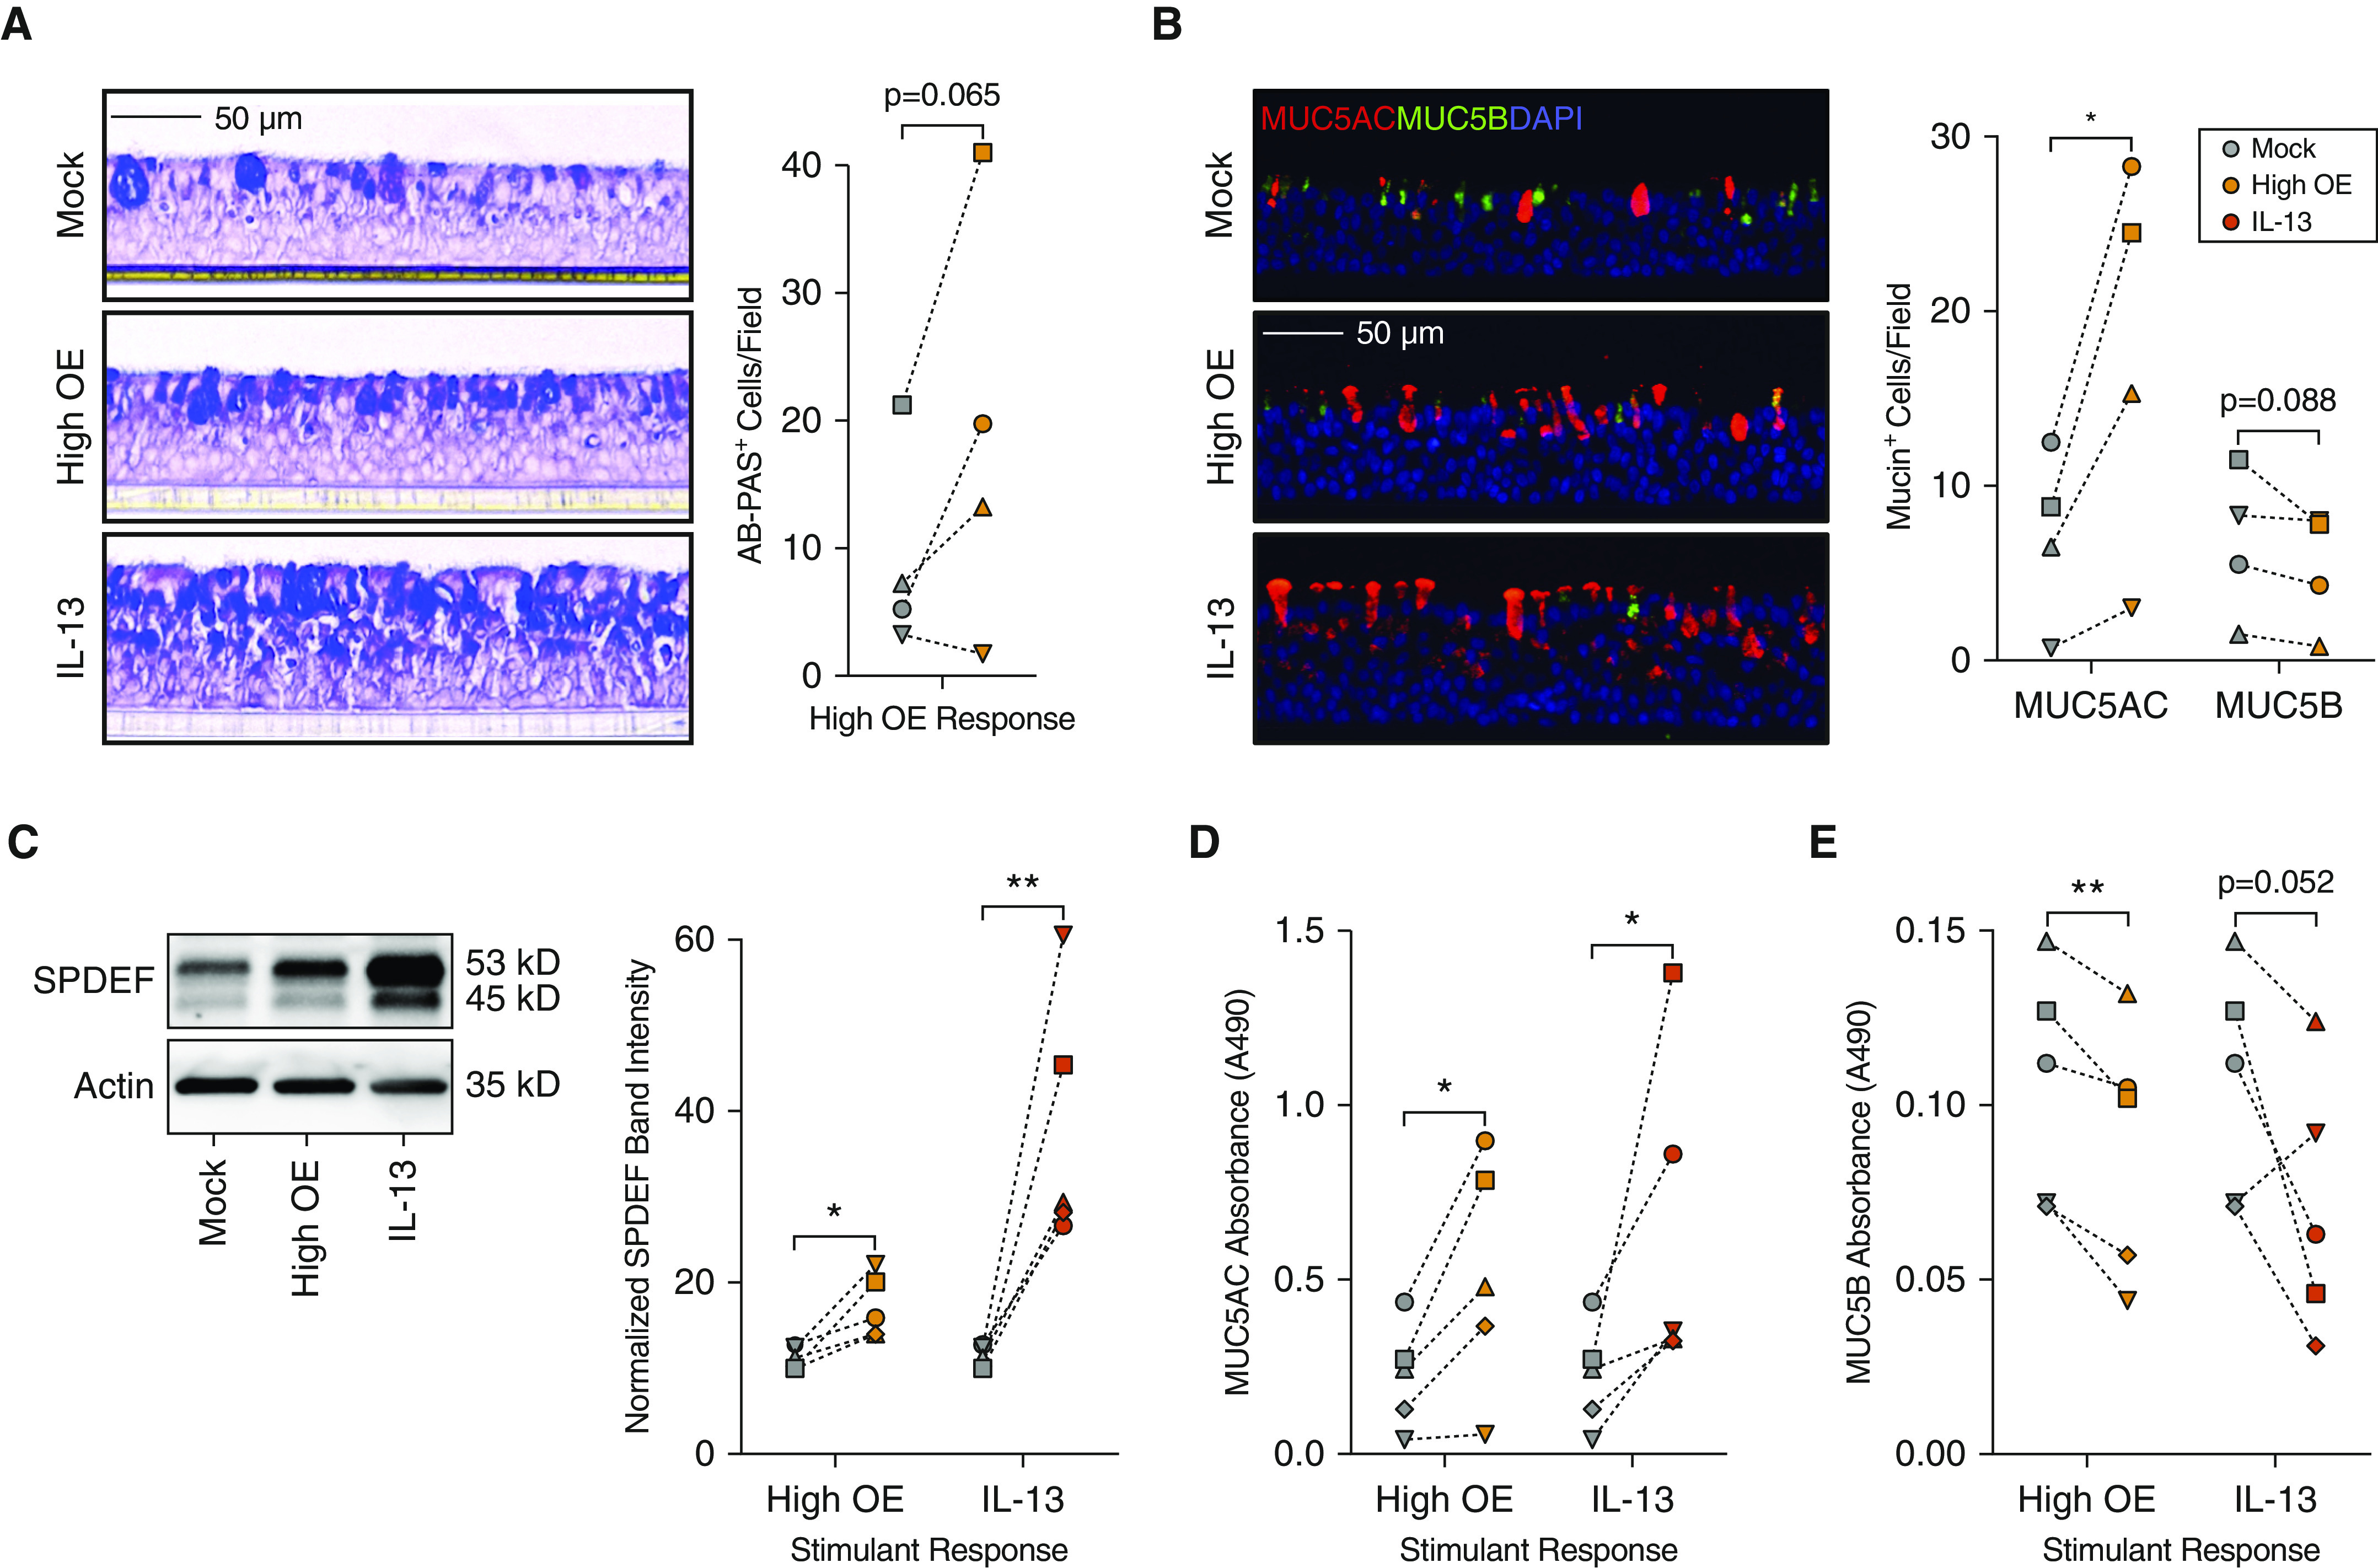
Chronic OE stimulation increases the number of MUC5AC+ cells and MUC5AC secretion. (A) Left panel: alcian blue–periodic acid-Schiff (AB-PAS) staining of culture histological sections for mucopolysaccharides/mucins. Right panel: quantification of AB-PAS+ cells. Scale bar, 50 μm. (B) Left panel: immunofluorescence labeling of culture histological sections for gel-forming mucins MUC5AC (red) and MUC5B (green). Nuclei were stained with DAPI (blue). Right panel: quantification of MUC5AC+ and MUC5B+ cells. Scale bar, 50 μm. Images for A and B are representative of labeling performed in cultures from four donors. (C) Left panel: Western blot analysis of total protein for SPDEF (SAM pointed domain containing ETS transcription factor) expression. Images are representative of data from five independent donors. Right panel: quantification of SPDEF Western blot band intensity normalized to actin expression as a loading control. (D and E) Colorimetric ELISA absorbance readings at 490 nm (A490) for MUC5AC (D) and MUC5B (E) detection in ATP-induced secretions of cultures from five donors. Statistically significant differences (*P < 0.05 and **P < 0.01) were determined by paired, one-tailed t test (on the basis of direction suggested by transcriptomic analyses). Independent donors are represented by data point shape, and connecting lines indicate paired mock- and OE- or IL-13–treated cultures.