
Figure 6.
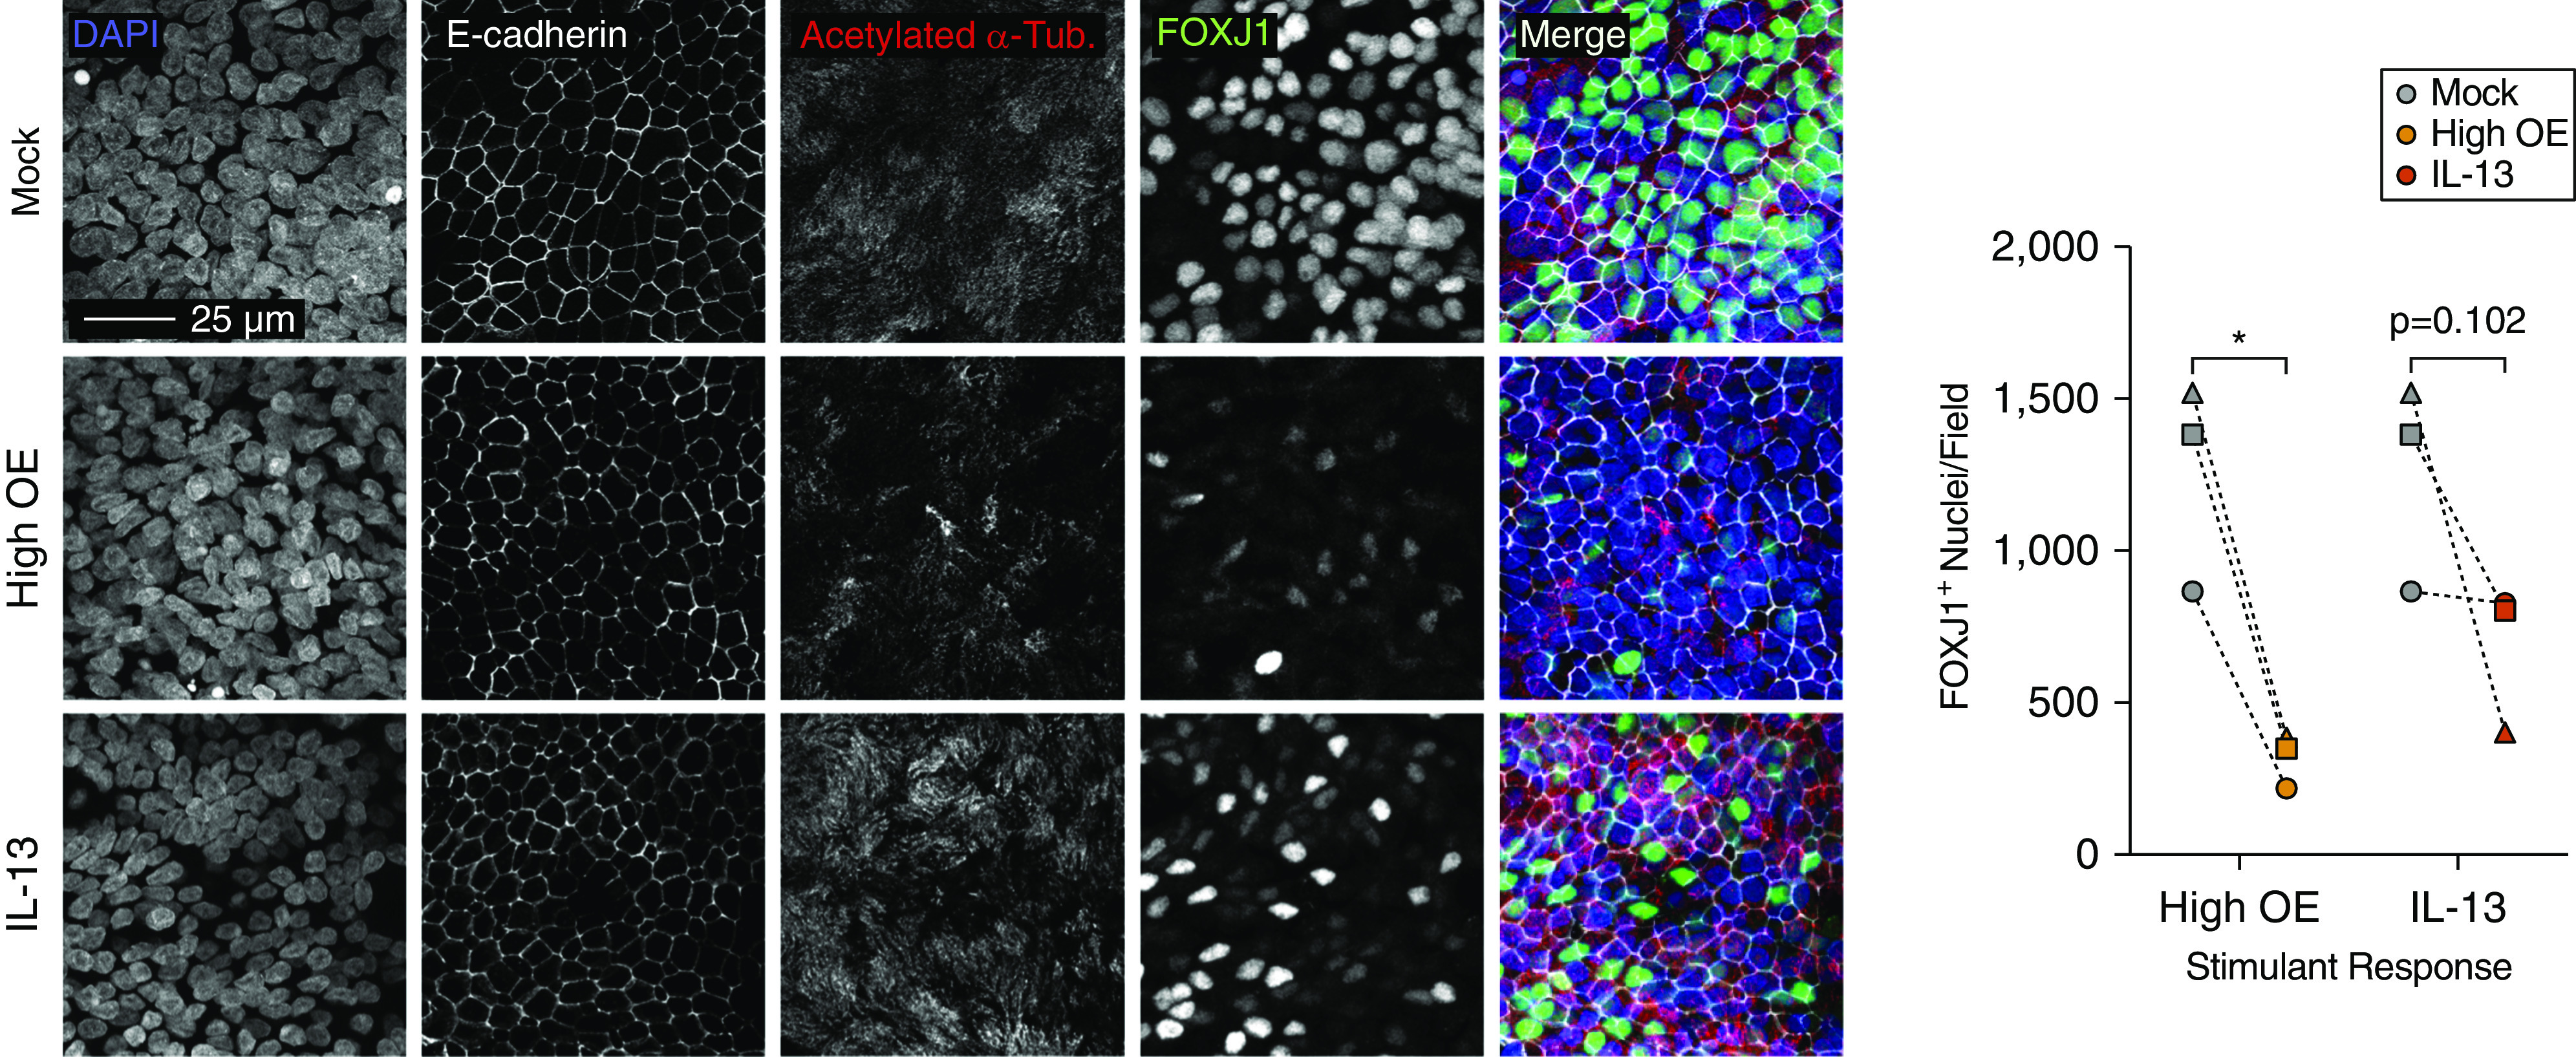
Chronic OE impairs FOXJ1 (forkhead box J1) expression in ciliated cells. Left panel: confocal fluorescence microscopy maximum projections of intact epithelial cultures labeled for E-cadherin (white), acetylated α-tubulin (red), and FOXJ1 (green). Nuclei were stained with DAPI (blue). Images are representative of labeling performed in cultures from three donors. Scale bar, 25 μm. Right panel: quantification of FOXJ1+ nuclei. Statistically significant differences (*P < 0.05) were determined by paired, one-tailed t test (on the basis of direction suggested by transcriptomic analyses). Independent donors are represented by data point shape and connecting lines indicate paired mock-treated and OE- or IL-13–treated cultures.