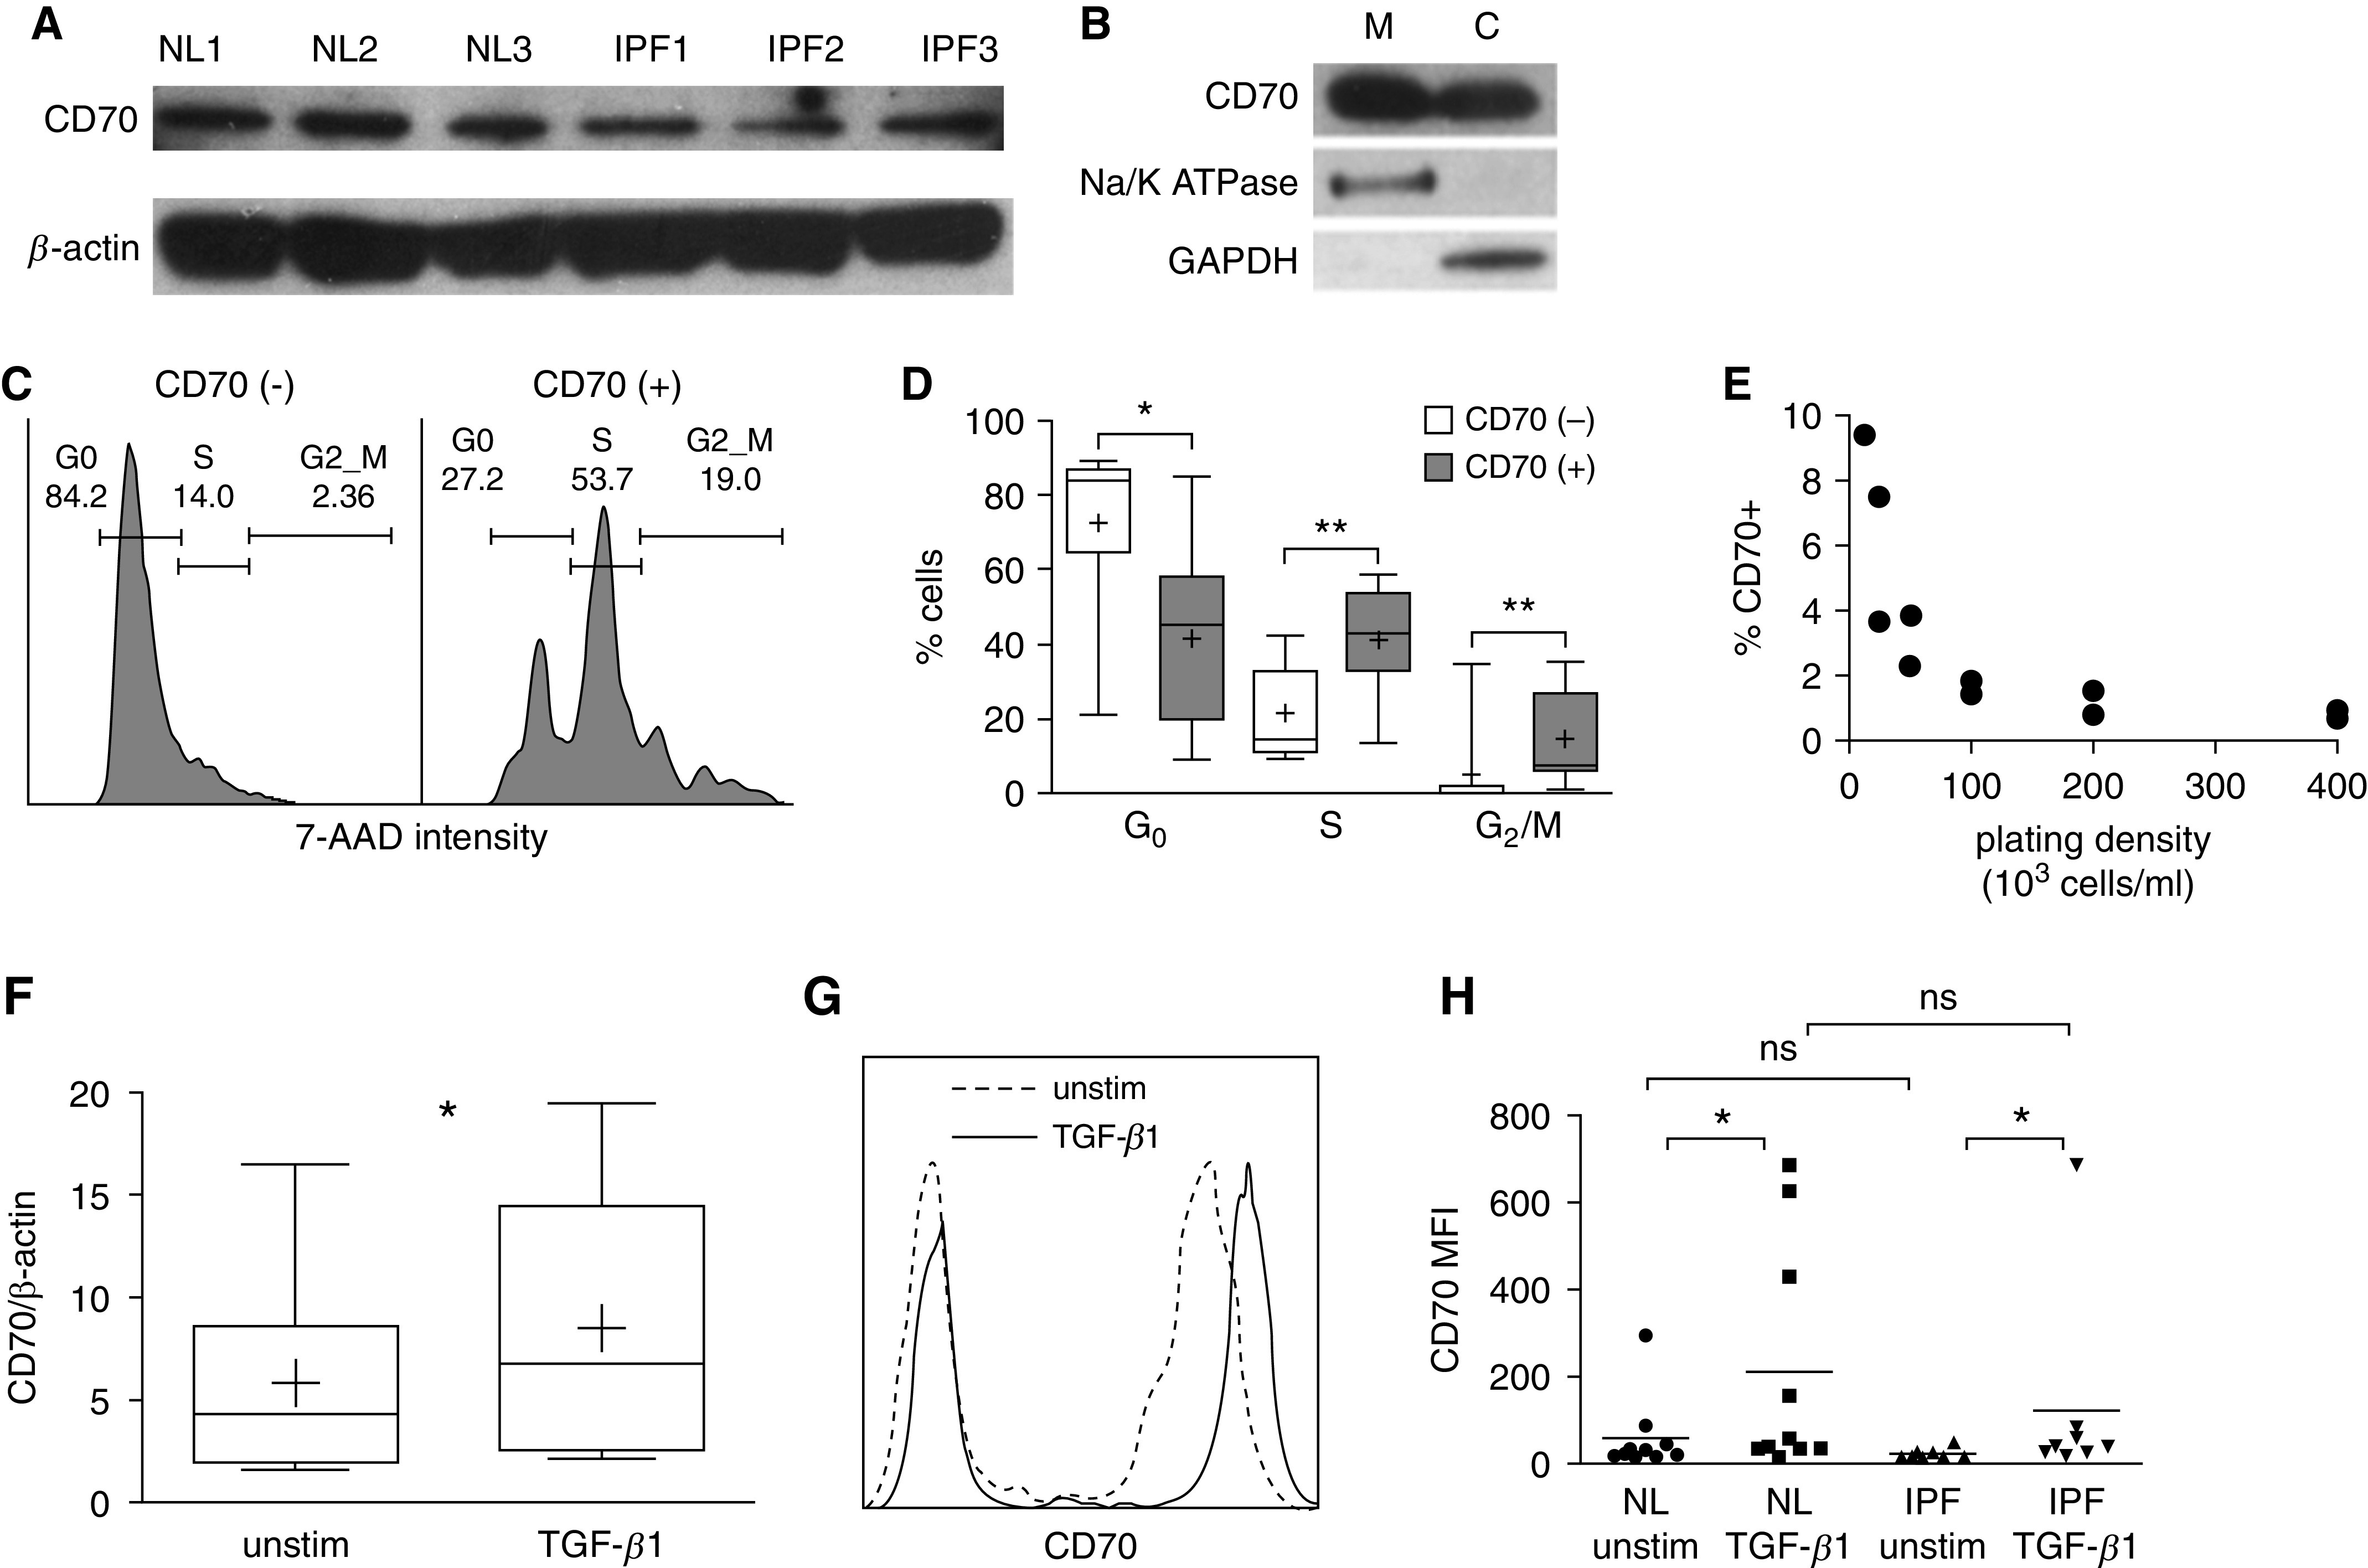
Figure 2.

CD70 expression in human pulmonary fibroblasts. (A) Immunoblot analyses of lysates from six healthy (NL) subjects and six patients with IPF showed variable amounts of CD70 (half of these studies are depicted here). (B) Differential immunoblot analyses of fibroblast compartments showed that CD70 is present on both membrane (M) and cytosolic (C) fractions (n = 6). Na+,K+-ATPase was used as a control for the presence of membrane proteins, and GAPDH was used as a control for the cytosolic fractions. (C) Representative cell cycle analysis by flow cytometry shows that CD70null pulmonary fibroblasts within cultures were predominantly in G0 phase, whereas there were greater proportions of S and G2/M cells among the CD70+ fibroblasts. The proportions of cells in each phase are denoted. (D) Compilations and quantitation of these results (n = 9) confirmed that the cell cycle differences were significant: *P < 0.05 and **P < 0.01. The lowest, second lowest, middle, second highest, and highest lines represent 10th, 25th, median, 75th, and 90th percentiles, respectively. Mean is denoted by (+). (E) The proportions of CD70+ fibroblasts after 48 hours in culture were inversely related to cell-plating density (n = 10). (F) CD70 mRNA expression, normalized to β-actin mRNA, was increased from baseline (unstim) by TGF-β1 (transforming growth factor-β1) (2 ng/ml for 24 h; n = 8; *P = 0.05). (G) Representative flow cytometry plot showing that CD70 surface expression was increased 24 hours after TGF-β1 stimulation. (H) Flow cytometry quantitation and compilation showed that TGF-β1 stimulation increased CD70 surface expression, expressed as mean fluorescence intensity (MFI), compared with basal conditions (unstimulated) in primary lung fibroblast lines from 10 healthy human donors and 8 IPF lungs (*P ≤ 0.05 and ns). 7-AAD = 7-aminoactinomycin D; NL = healthy human lungs; ns = not significant; unstim = unstimulated.
