Figure 5.

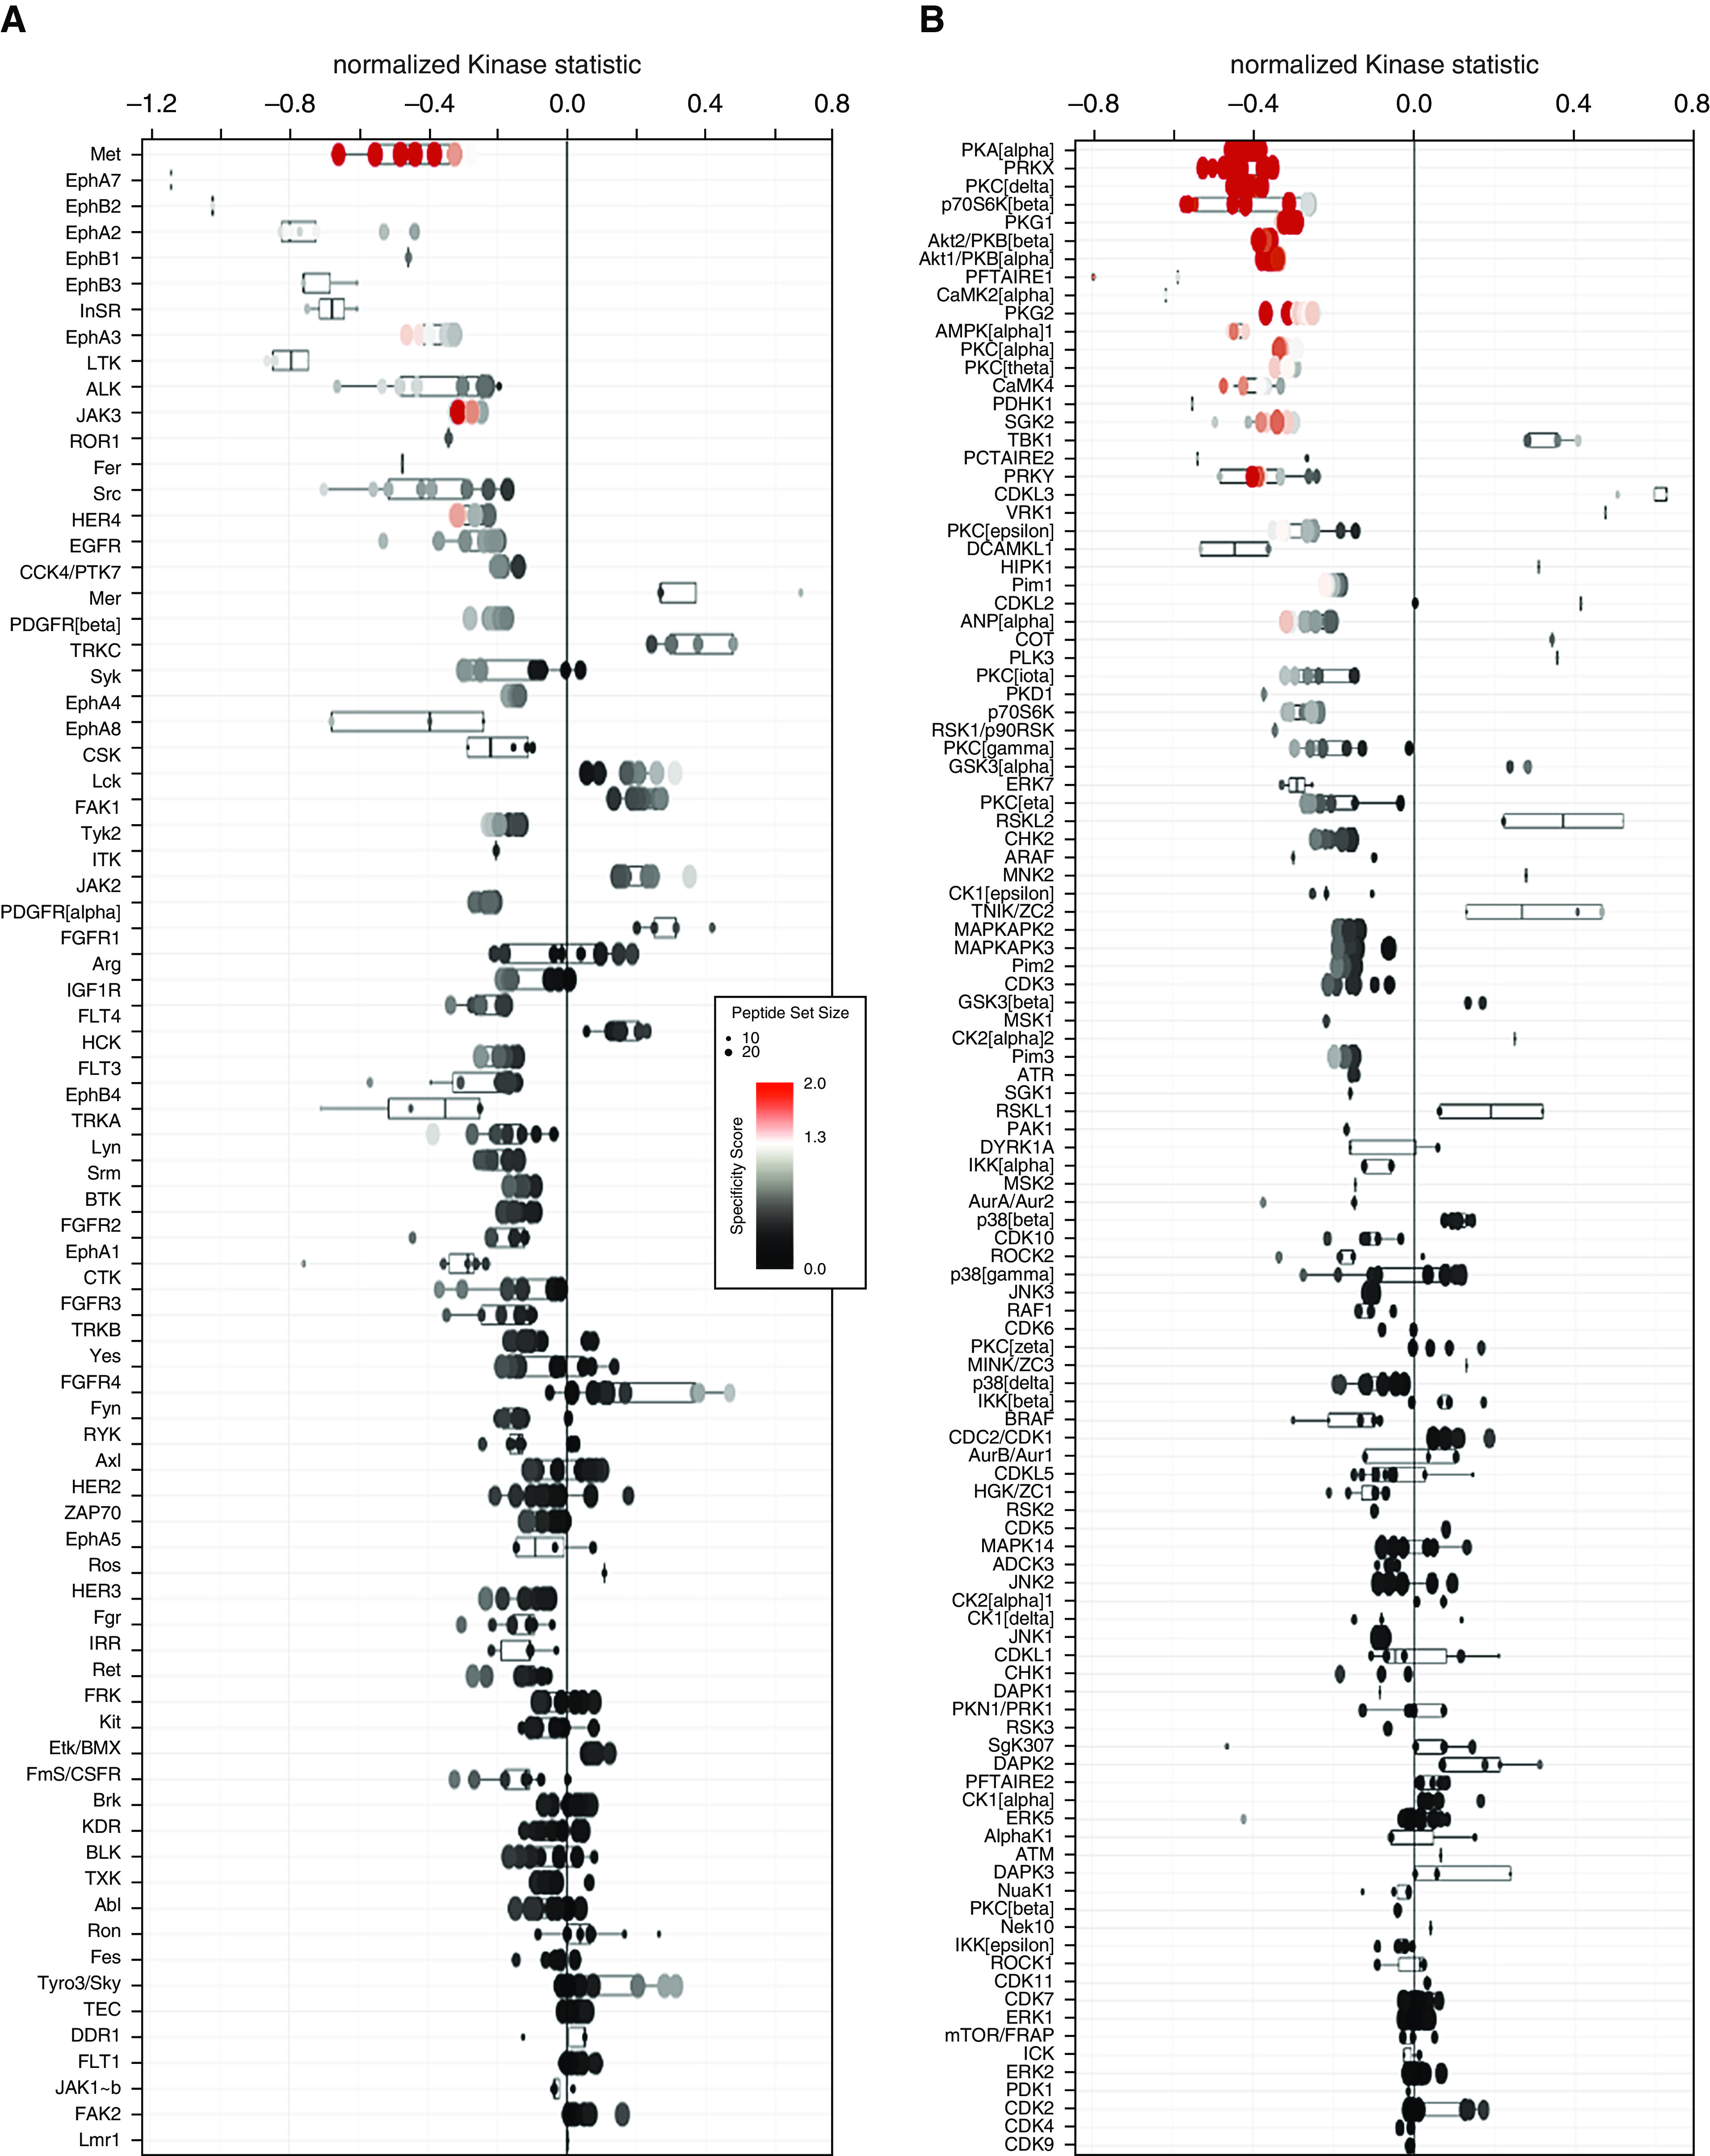
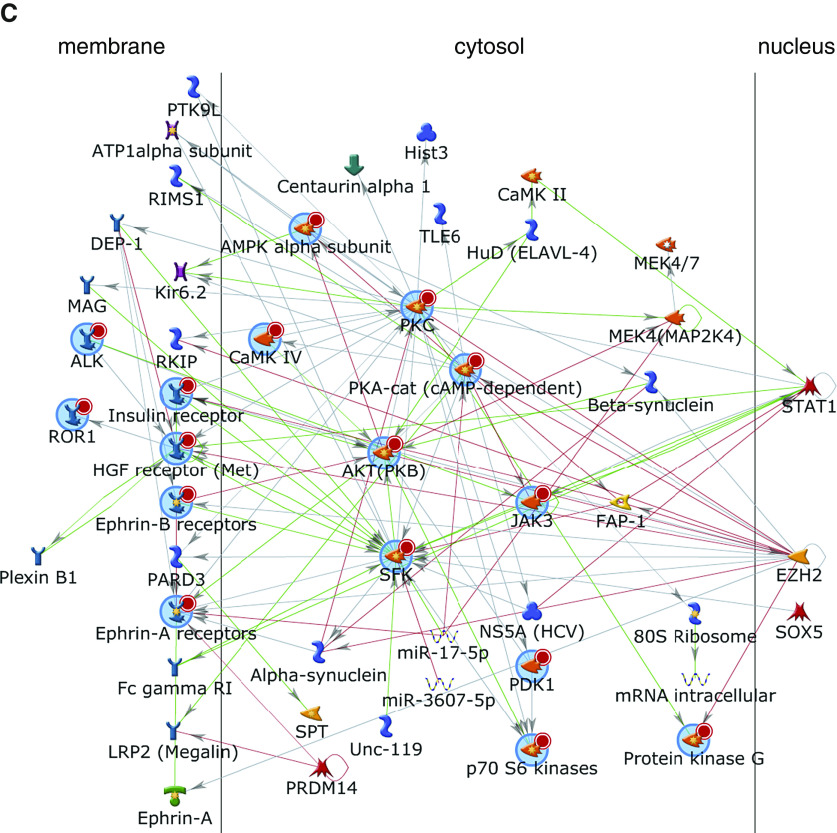
Signal transduction induced by fibroblast CD70 ligation. (A and B) Kinomic profiling using whole-chip peptides showed that CD70 ligation increased activities of a number of tyrosine kinases (A) and serine/threonine kinases (B), as measured by mean kinase statistics (43, 44). A normalized kinase statistic less than 0 indicates an increase in kinase activity in the CD70 antibody–treated group compared with the isotype control group (each consisting of four matched pairs of different primary pulmonary fibroblast lines). See also Tables E7 and E8. (C) Annotated network modeling of CD70 activation signaling effects in fibroblasts. Arrows denote the direction of interaction, and the color of the lines indicates the type of interaction (green = positive; red = inhibitory; gray = complex). A more detailed figure legend for this network can be found in Figure E7.

