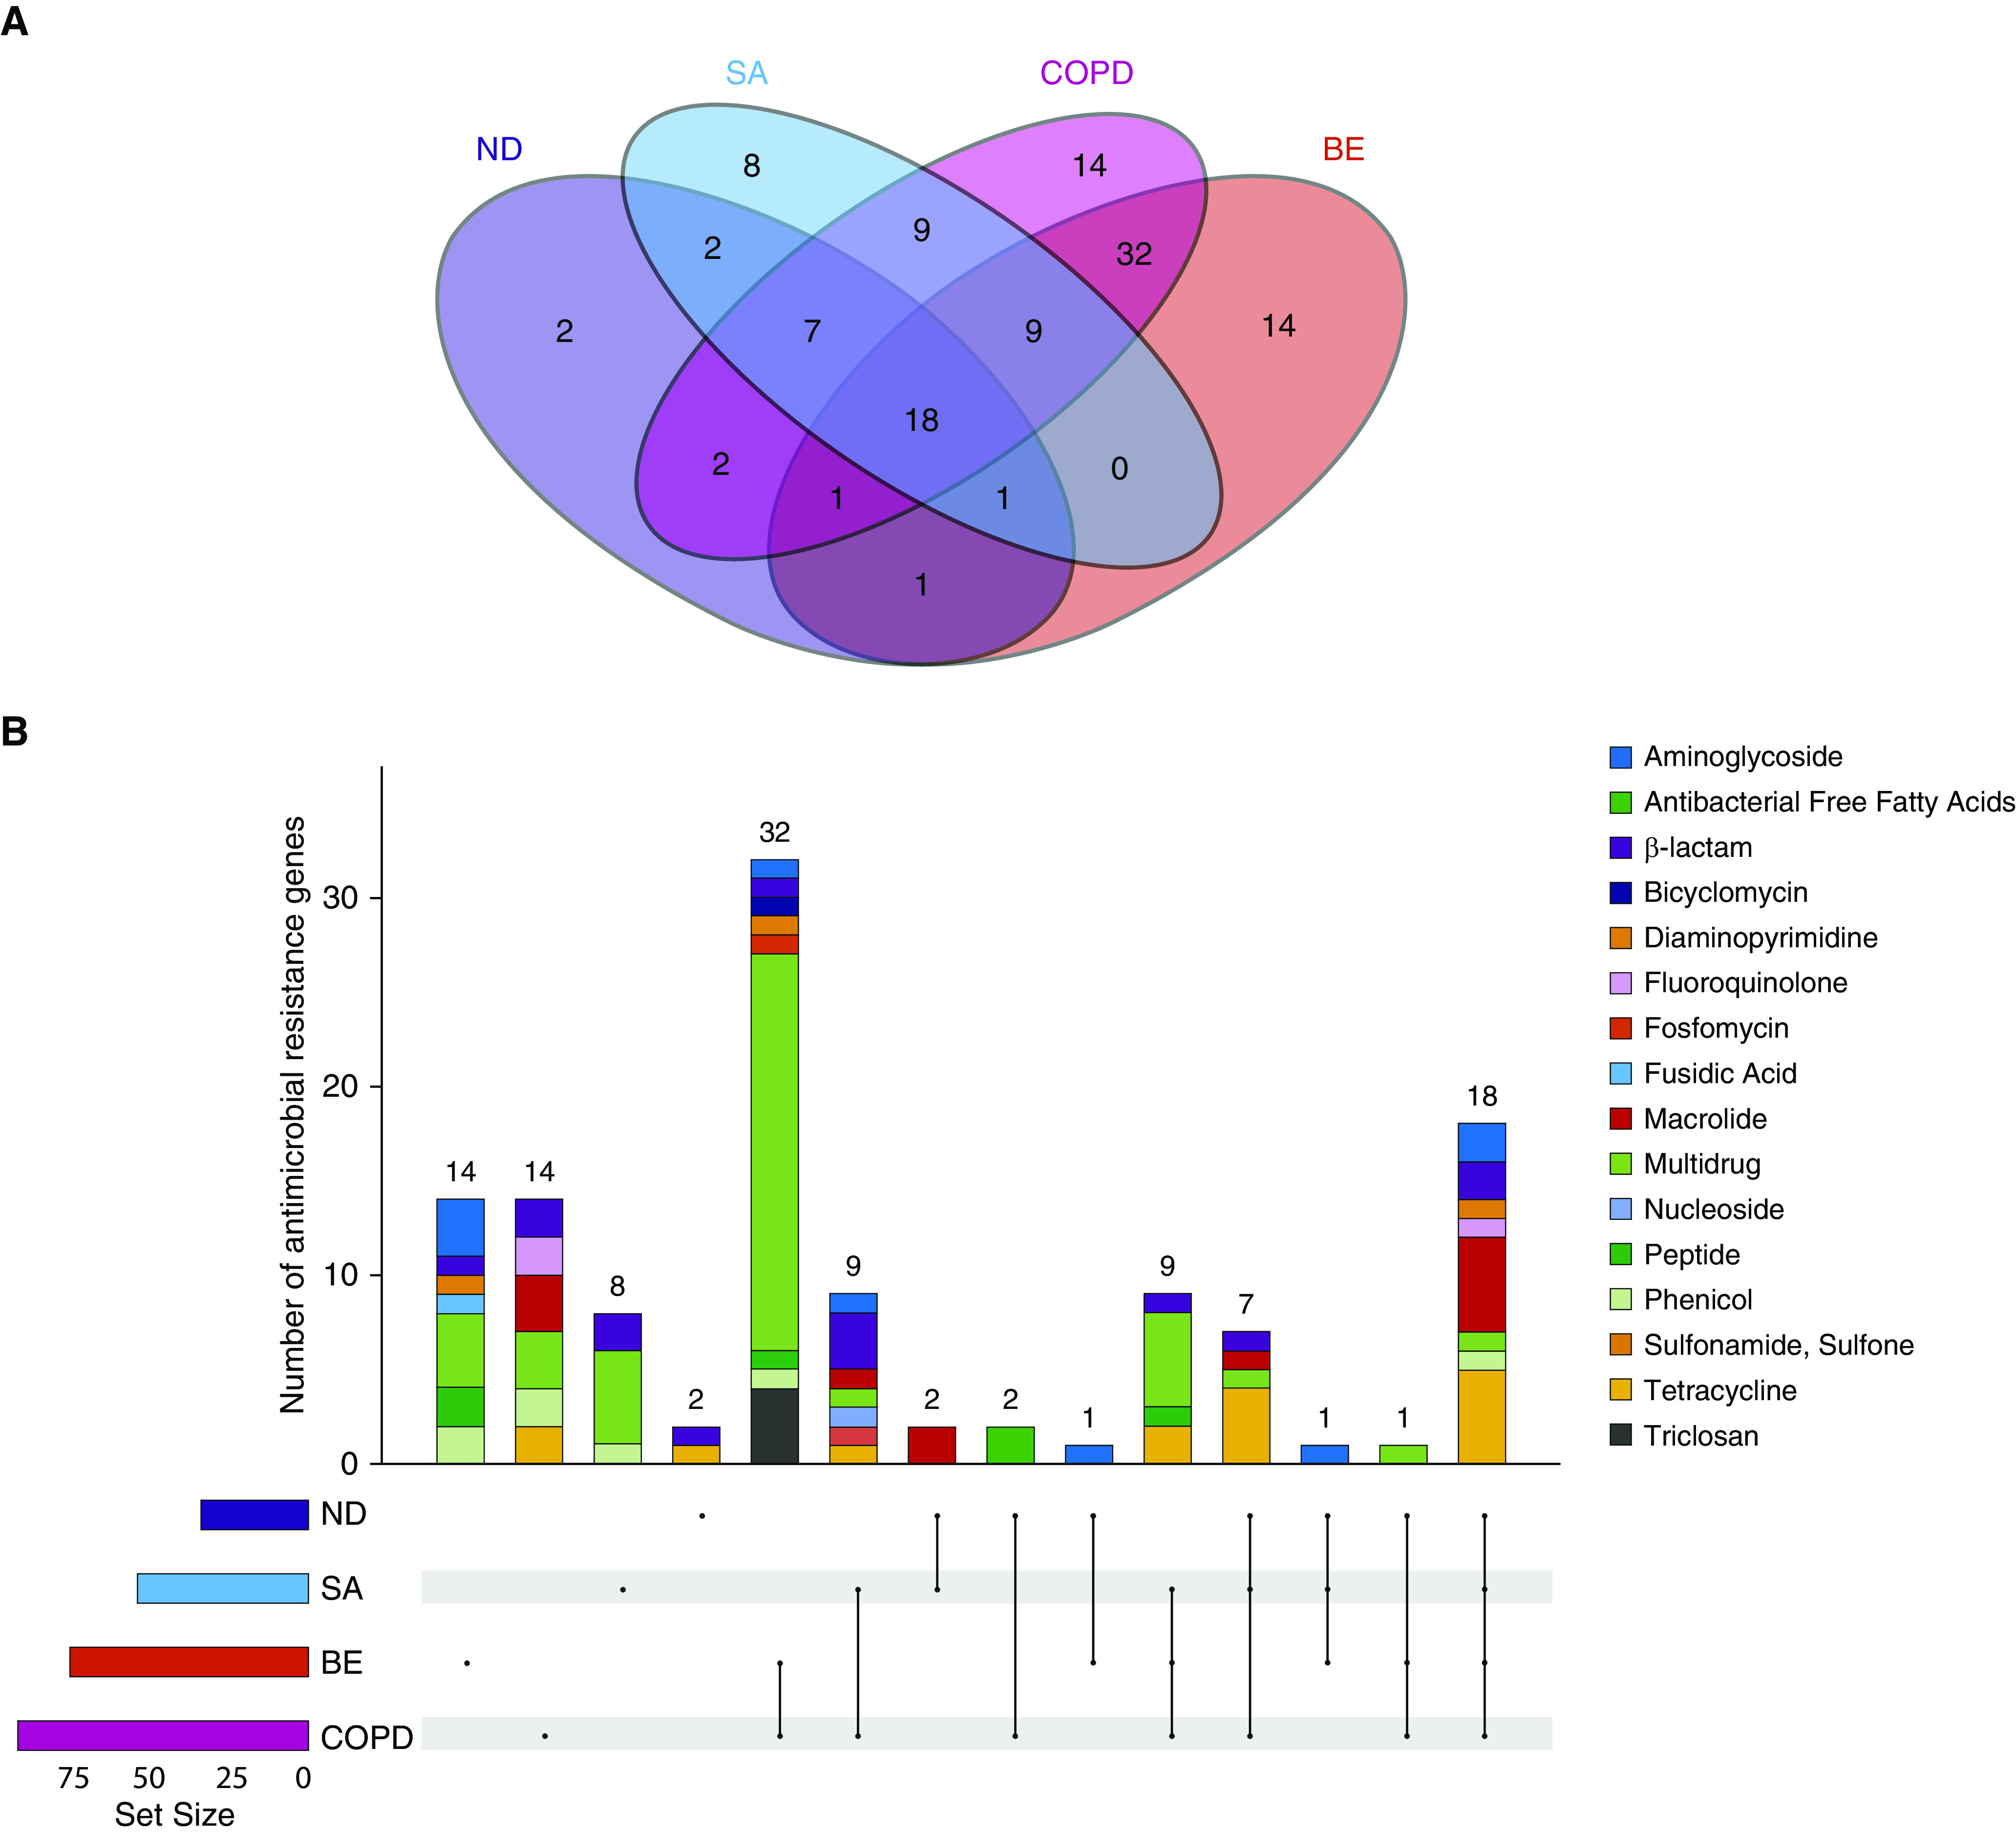
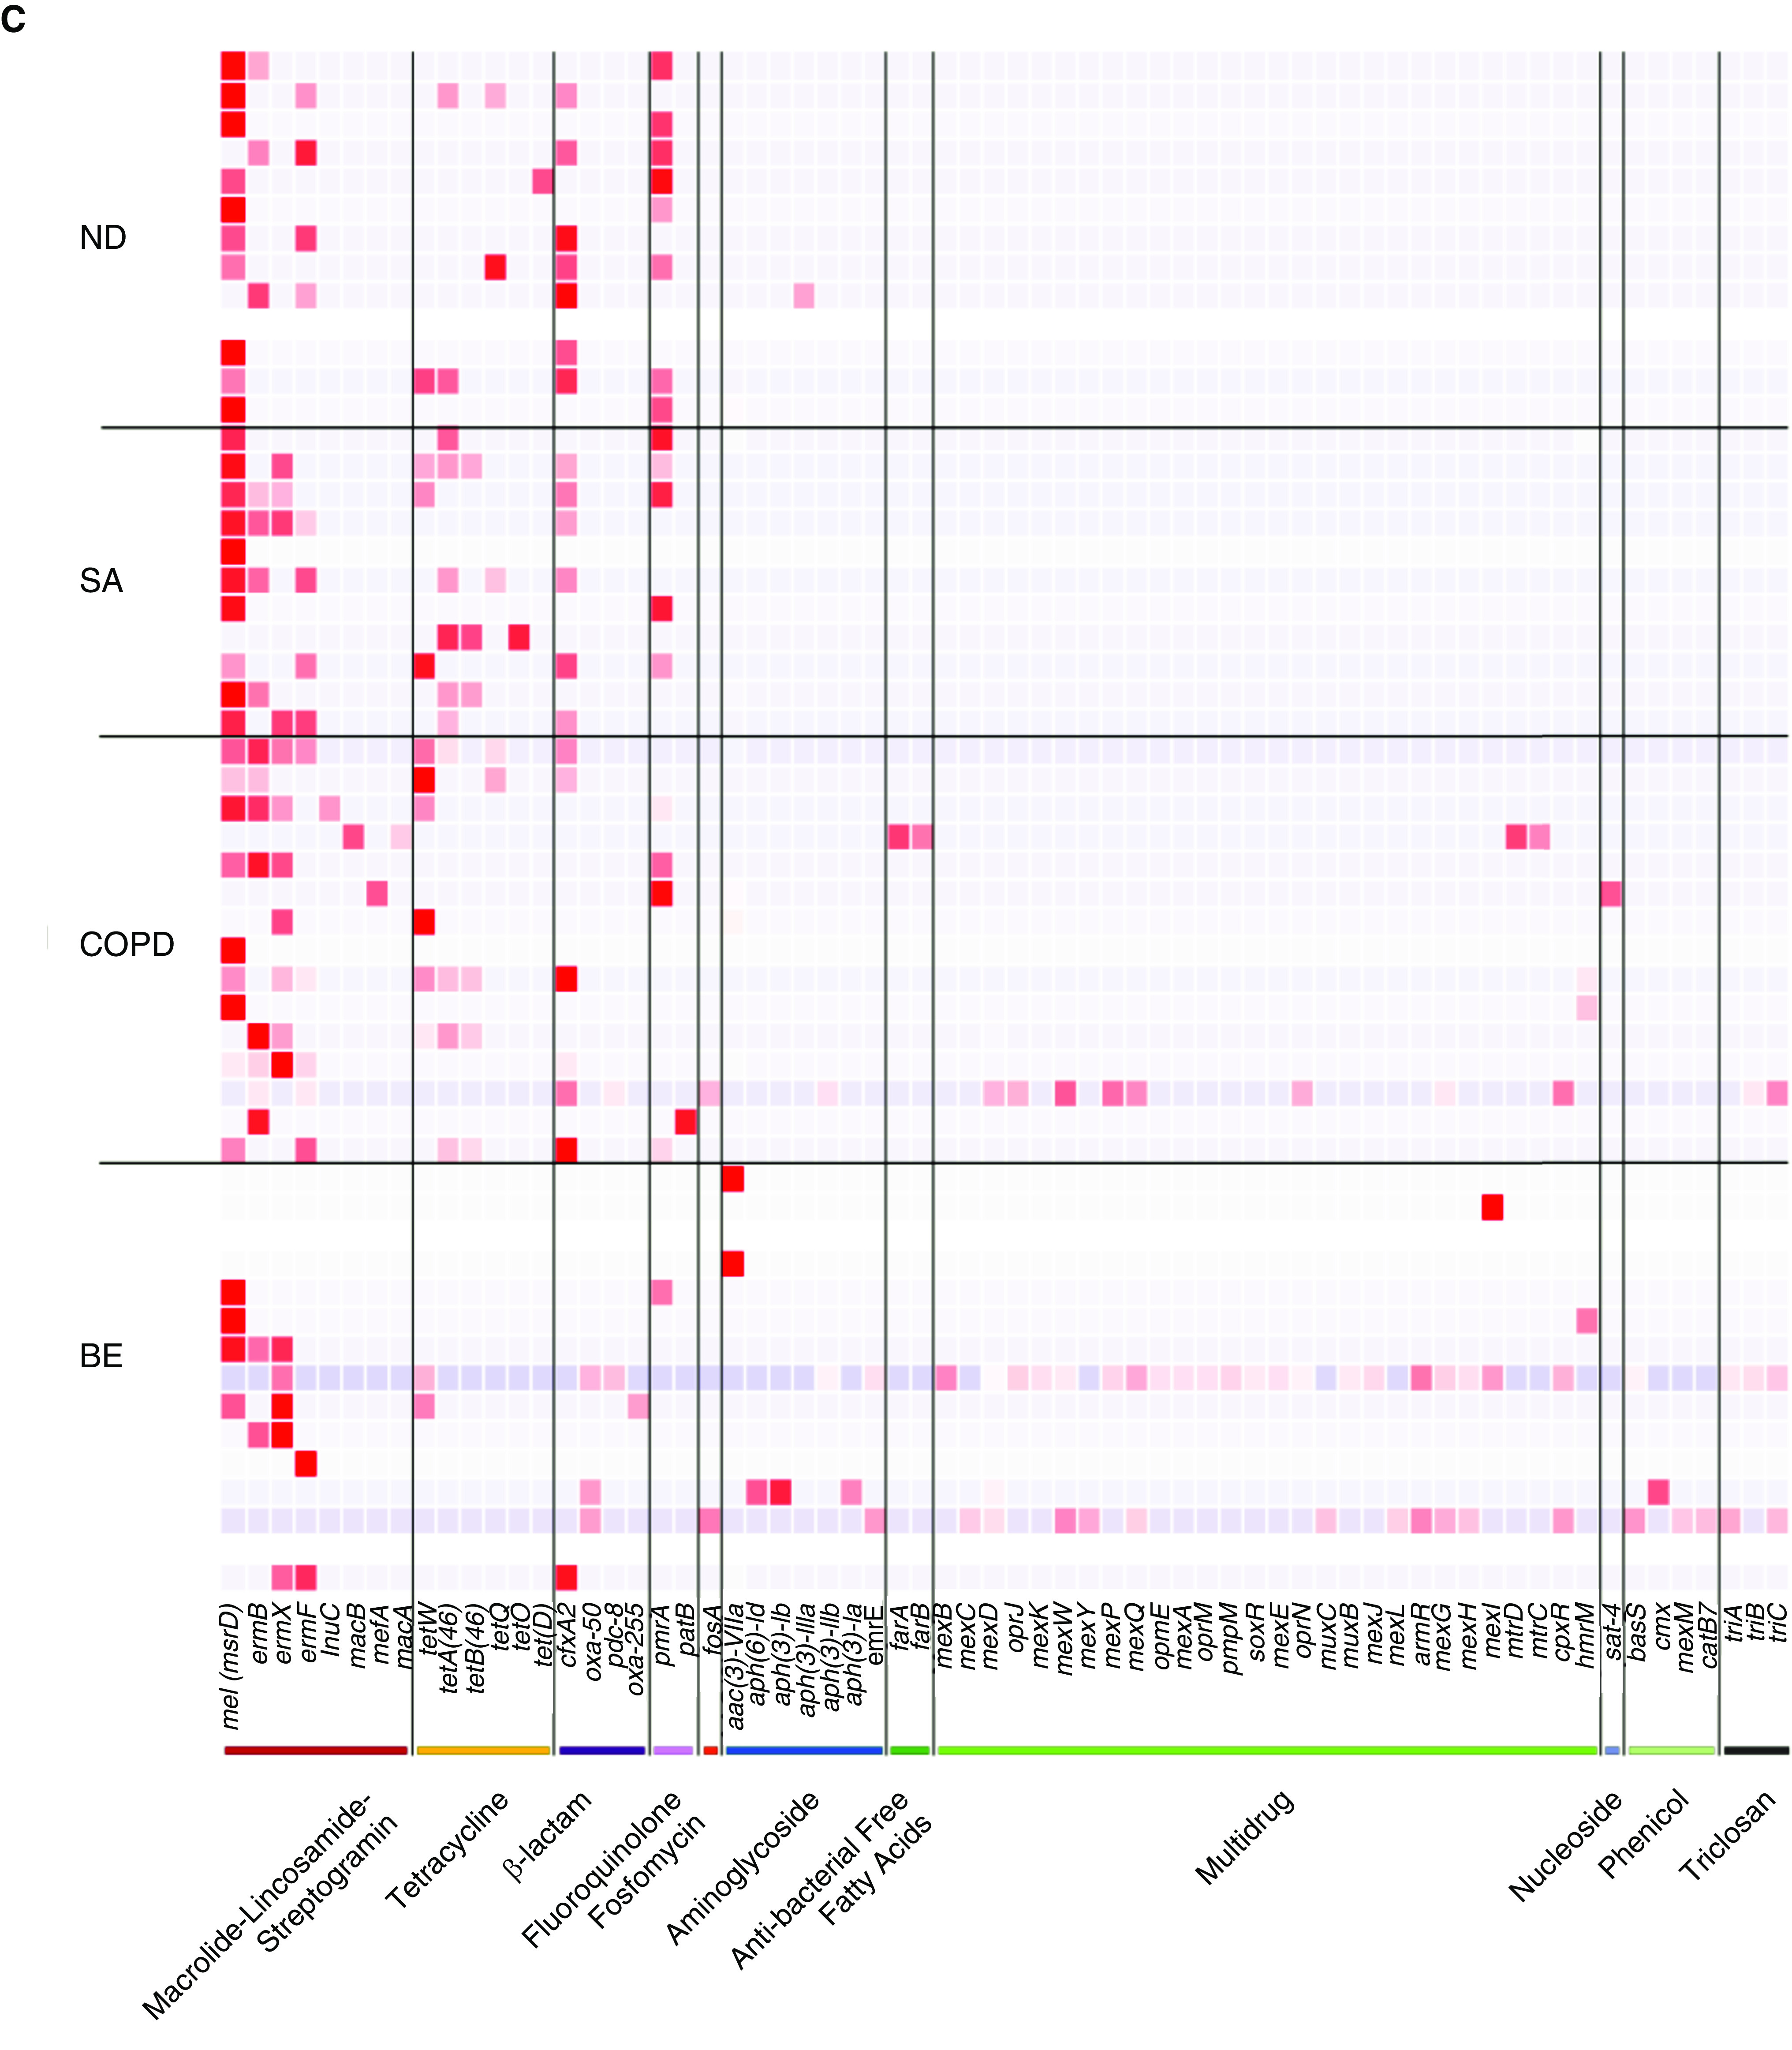
Figure 2.


A core airway resistome exists across respiratory disease states including antibiotic-naive and nondiseased (healthy) individuals. (A) Venn diagram illustrating the number of individual antibiotic resistance genes among the study cohorts and their intersections. (B) An upset plot, corresponding to the presented Venn diagram in A, illustrating the antibiotic resistance gene composition across individual cohorts and their intersections. Stacked bar charts reflect the detected antibiotic resistance genes colored according to antibiotic class. Individual groups and their intersections are indicated for each cohort separately (ND, SA, COPD, and BE), followed by their respective intersection by a matrix (located below stacked bars). Set size (i.e., the number of resistance genes detected per group) is indicated by horizontal bars (ND < SA < COPD < BE). Black dots indicate sets, and connecting lines indicate relevant intersections related to each stacked bar chart. An 18-gene core resistome was identified (across all four cohorts) and largely comprises genes conferring macrolide, tetracycline, β-lactam, and aminoglycoside resistance, whereas the 32 genes shared by patients with COPD and patients with bronchiectasis are predominantly multidrug and triclosan resistance classes. (C) Heatmap illustrating specific antibiotic resistance genes by class and individual cohort. Specific antibiotic resistance genes grouped by colored class (x axis) are plotted against individual cohorts (ND, SA, COPD, and BE) (y axis). Genes are presented in order of detected abundance with msrD (mel), ermB, ermF, and ermX macrolide resistance genes most frequently observed across all four cohorts followed by genes encoding tetracycline, β-lactam, and fluoroquinolone resistance. BE = bronchiectasis; COPD = chronic obstructive pulmonary disease; ND = nondiseased; SA = severe asthma.
